'/%3e%3cellipse%20opacity='0.34'%20cx='327.5'%20cy='339'%20rx='264.5'%20ry='264'%20fill='url(%23paint1_linear_12724_35442)'/%3e%3cdefs%3e%3clinearGradient%20id='paint0_linear_12724_35442'%20x1='327'%20y1='-2.524e-06'%20x2='327'%20y2='389.286'%20gradientUnits='userSpaceOnUse'%3e%3cstop%20stop-color='%2327D9E5'/%3e%3cstop%20offset='0.927406'%20stop-color='%23004047'%20stop-opacity='0'/%3e%3c/linearGradient%3e%3clinearGradient%20id='paint1_linear_12724_35442'%20x1='328.02'%20y1='74.7771'%20x2='328.02'%20y2='395.312'%20gradientUnits='userSpaceOnUse'%3e%3cstop%20stop-color='%2327D9E5'/%3e%3cstop%20offset='0.927406'%20stop-color='%23004047'%20stop-opacity='0'/%3e%3c/linearGradient%3e%3c/defs%3e%3c/svg%3e)
Trade Wars and Price Hikes: How Uncertainty Drives Preemptive Pricing
NewsHow trade war uncertainty drives price spikes: data-backed analysis of tariffs, profits, and consumer costs.


Adomas Sulcas
Research coducted by a lead researcher Justas Vitaitis , data analyst Kasparas Kajus Jucaitis , sponsored by IPRoyal.
Finding Highlights
- Primary Finding: Reciprocal trade war escalation produced opportunistic price increases 4.6 times larger than normal market variation, while unilateral tariffs on the same products showed no statistically significant effect.
 2-week price increases before, during, and after the Trade War period.
- Scale of Impact: During the April 2-May 12, 2025 trade war period, 43% of analyzed products experienced simultaneous price increases averaging 1.81% per two-week period (p < 0.001, indicating less than 0.1% probability of occurring by chance).
- Timing Evidence: Price increases occurred immediately following trade war announcements, weeks before tariffed goods reached retail shelves.
- Opportunistic Pricing: Median prices reverted to 95.3% of pre-trade war levels by September 2025, indicating the increases were largely opportunistic rather than cost-driven.
- Macroeconomic Context: The 2025 tariff measures affected $320 billion worth of steel and aluminum products alone, with economic models projecting a 1.4% decline in real US wages by 2028 and approximately 1% reduction in GDP
- Category-Specific Effects: Product categories with high Chinese market concentration experienced the largest price increases: toy stacking blocks (+7.14%), rotating power toothbrushes (+5.89%), and complete badminton sets (+5.38%).
- Policy Implication: The manner of trade policy implementation (particularly whether it triggers reciprocal escalation and high-visibility framing) may matter as much as the tariff rates themselves for immediate consumer welfare impacts.
Introduction
Tariffs are taxes on imported goods that governments employ for various purposes: protecting domestic industries, generating revenue, or exercising negotiating leverage in international relations. Proponents argue that strategically implemented tariffs can shield domestic producers from unfair competition, preserve local employment, and address trade imbalances.
Many economists, however, argue that while tariffs may achieve specific protectionist goals, they typically reduce overall economic efficiency and consumer welfare[^1]. Any tax or levy raised at the point of entry is paid by the importing business, which must either absorb the cost—risking business continuity—or pass it onto consumers.
Beyond these direct costs, tariffs create “deadweight loss”: economic value destroyed when consumers buy less of the now-expensive imported goods while inefficient domestic producers expand production. Cost inefficiency, combined with higher consumer prices, leads many economists to view tariffs as ultimately self-defeating, even when they successfully protect targeted industries.
In 2025, the world experienced a major shock to the status quo of global free trade as the United States imposed, intended to impose, or intends to impose tariffs on a large number of trading partners. Throughout the year, the US imposed or announced tariffs on nearly all imports, with just the specialized tariffs on steel and aluminum alone affecting $320 billion worth of products .
Economic policy and global politics aside, these changes presented a unique opportunity to reevaluate the impact of tariffs on various parts of the value chain.
Our report focuses on one such opportunity – business reaction to the announcement or implementation of tariffs. Even a verbal announcement may influence the decision-making process due to potential, foreseeable changes to a business’s supply chain.
Due to the inherent complexity of global supply chains, our analysis has been narrowed down to two aspects: tariffs (whether announced or implemented) and price changes. Economists would argue that the imposition of tariffs would almost always raise prices for the consumer; however, neither timing nor speed of change is taken into account.
Finally, a third dimension is taken into consideration – profit-maximizing behavior. Any proposed tax provides businesses with an incentive to raise prices. Even if such a levy is not implemented, price reduction would happen not through policy, but through competition. In simpler terms, businesses are incentivized to react quickly to potential losses than to potential savings.
Addendum: Data collection tools, infrastructure, and funding has been provided by IPRoyal , a leading residential proxy provider. The company is not directly involved in the import, export, or sales of physical goods, nor do they earn revenue through price strategy development.
“Proxies power everything from thriving businesses to groundbreaking research. We’re proud to support researchers, startups, and educational institutions who harness that infrastructure for discovery, innovation, and meaningful impact. That’s the future IPRoyal is building and will always stand for.” Mindaugas Čaplinskas, Cofounder and Strategic Advisor at IPRoyal
Scope & Methodology
Data Collection
Our research analyzed the prices of 1,900 products (100 products in each of 19 randomly selected categories) from September 2024 to August 2025. Price analytics include both category-wide and product-specific changes.
Throughout the main part of the document, average values are used. Median values are available in Appendix II.
Timeframe selection was influenced by the 2024 US Presidential Elections to take into account periods before the imposition of wide-ranging tariffs while also providing baselines for other potentially economically impactful events.
For benchmarking purposes, prices were also collected from June 2024 to September 2024 to assess whether non-tariff events had a measurable impact on product prices. The period is considered the control group, allowing us to assess general market tendencies while also measuring the potential impact of non-tariff, economically impactful events.
Our analysis showed that none of the June-September events made a statistically significant difference in prices; therefore, the aforementioned data was not included in this report.
Prices were collected from Keepa[^2], a database tracking historical prices on Amazon for over 5 billion products. Out of all available product categories, the following were selected:
- AAA Batteries
- Balance Boards
- Basic Crates
- Basic Office Calculators
- Complete Badminton Sets
- Countertop Blenders
- Extension Cords
- Handheld Vacuums
- Home Automation Hubs & Controllers
- LED & LCD TVs
- Laser Computer Printers
- Makeup sets
- Multivitamins
- Office Tape Dispensers
- Pet Cameras & Monitors
- Rotating Power Toothbrushes
- Skin Care Sets & Kits
- Toy Stacking Block Sets
- eBook Readers
With 100 products tracked in each category, our analysis covers 1,900 individual price histories throughout the observation period. Additionally, IPRoyal’s US-located residential proxies were used, when possible, to verify Keepa’s price accuracy. The initiative was soon deprecated as Keepa’s database was found to be consistently accurate.
Random selection allowed our research to cover a wide range of industries that include general-purpose goods used by nearly all consumers in hobby, business, or leisure categories.
Prices for each product were measured throughout the year, with particular attention paid to price changes 2 weeks before an economically important event and for 2 weeks after the economically impactful event.
Our price changes are calculated based on the average product price 2 weeks before the event, which is then compared to the average product price 2 weeks after the event.
Finally, random sampling was used to select a number of dates to assess average and median price changes per 2 weeks as a way to gauge regular market trends.
Definitions & Assumptions
An economically impactful event is defined as any event that may directly or indirectly impact global trade.
Examples of such events may include: declarations of war or escalation of hostilities, threats of restricting or blockades of important shipping routes (e.g., Strait of Hormuz), piracy or increased risk in important shipping routes, tariffs or other import or export restrictions.
Non-tariff events are economically impactful events that include all the events listed above, except for tariffs and import or export restrictions.
Tariff events were categorized and assigned a label based on the following criteria:
- Announced. Any tariff that was reversed within 2 weeks of announcement or was implemented on a date later than 2 weeks after initially announced.
- Imposed. Any tariff that was implemented within 2 weeks of announcement and was not reversed within the same time period.
Preemptive price increase is considered a business-initiated price raise for any good in reaction to an economically impactful event when at least one condition applies:
- Event is only announced, threatened, or otherwise verbally mentioned, but does not transpire.
- Event is announced and an implementation date is set, but prices increase before the date of implementation.
- Event transpires, but is resolved or reversed within less than 2 weeks.
- Price increases happen in tandem with an announcement and implementation (if both happen on the same day).
Implementation lag is defined as the duration of time that elapses between an official change in economic policy (e.g., imposition of tariff) and actual changes in levies charged[^3]. Lag may be affected by grace periods, staff training requirements, implementation of new codes and systems, etc.
Our preemptive price increase assumes that at least one of the following conditions are true:
- Retailers purchase inventory in amounts intended to last longer than a few business days.
- Goods en route to a point-of-entry have not yet been affected by economic policy changes due to grace periods.
- Additional goods are often purchased in larger quantities when tariffs are announced to avoid incurring extra costs.
“Most retailers plan inventory months in advance, sometimes up to a year for non-perishable goods. Price increases happening within two weeks are likely due to other factors, not tariffs.” Ignas Dirma, Head of Digital at Pando Moto[^4]
Baseline price changes were acquired by a random sampling of dates that did not include any days that coincided with selected economically impactful event dates. Methodology for deriving the averages and medians of the baseline changes was otherwise identical.
Weekly inflation rates from the US Bureau of Labor Statistics were considered but not used as a baseline, as BLS data encompasses a broader product basket than our study and reflects aggregate trends across categories experiencing both inflation and deflation.
Our product-specific baseline (0.39%) more accurately captures normal price variation for the categories analyzed.
Events
A total of 36 events were selected as potentially economically impactful:
- Tariffs. A total of 25 tariff-related events (from January 2025 to July 2025) were analyzed, of which 10 were considered announced, with the remainder (15) considered imposed.
- Non-tariff events. A total of 11 events were selected, of which 4 were direct vessel attacks related to the Red Sea Crisis (primarily concentrated in June-September 2024, with attacks subsiding in Autumn 2024 ), and 7 involving military threats and escalation in shipping lanes.
A full list of events, dates, and categories is available in Appendix I.
The temporal distribution of these events served as a foundation for a potential economical experiment. Many of the non-tariff events were concentrated in our control period (June-September 2024), while tariff events occurred during our primary study period (January-July 2025). The separation allowed us to isolate the price effects of tariff announcements from other supply chain disruptions.
Hypotheses & Questions
There were several central questions in our study:
- Do tariff announcements affect prices independently of their implementation?
- How quickly are prices affected by either announcements or implementations of tariffs?
- Are reciprocal tariffs more impactful than unilateral tariffs?
- Do announced-but-not-implemented tariffs cause similar price increases to implemented tariffs?
These questions assume that tariffs eventually affect consumer prices through some mechanism. We consider this assumption uncontroversial, as economic theory and empirical evidence consistently show that import taxes are at least partially transmitted to consumer prices.
Our focus is not on whether but on when and how those price changes occur – whether they happen preemptively in response to announcements or gradually following implementation.
Based on profit-maximizing behavior and market dynamics, we hypothesized that:
- H1: High-visibility, broad-scope tariff announcements (trade war escalation) trigger preemptive price increases
- H2: Limited-scope or low-visibility tariffs show delayed/minimal price effects
- H3: Trade war uncertainty and narrative drive preemptive pricing more than actual tariff implementation
Our analysis isolates whether anticipatory pricing stems from tariff announcements themselves or specifically from the escalation to reciprocal trade conflict. Additionally, our analysis of imposed tariffs evaluates the speed of price transmission when policy announcements are actually implemented.
Executive Summary
Our analysis of 1,900 products reveals that high-visibility trade war escalation triggers statistically significant preemptive price increases, with a mean of 1.8% (95% CI: [1.336 – 2.264]). This represents a 4.6-fold increase over normal price fluctuations of 0.39% (95% CI: [0.156 – 0.633])
In contrast, limited-scope tariffs, including the March 10th reciprocal tariff imposed by China, showed no significant price effects.
Unilateral tariffs showed a modest increase of 0.22% above baseline, but with overlapping confidence intervals (95% CI (baseline) [0.156 – 0.633] vs (unilateral) [0.298 – 0.902]), we cannot reject the null hypothesis that this difference is due to random variation.
Other economically impactful events, including direct attacks on commercial shipping, produced no measurable price effects.
Reciprocal tariffs were most pronounced during the US-China Trade War period (2nd of April, 2025 to 12th of May, 2025[^5]). Starting from the 2nd of April 2025, prices began rising at a pace of 1.61%, accelerating to 2.04% (95% CI [1.132 – 2.948]) per 2 weeks on average, with nearly 43% of all products affected.
Our findings are additionally supported by category-specific patterns: during the reciprocal tariff period (April 2-9, 2025), multiple categories showed substantial price increases, with peak impacts ranging from 3.90% to 7.14% across different product types, including toy stacking blocks (7.14%), rotating power toothbrushes (5.89%), and complete badminton sets (5.38%).
Chinese exports make up 45% (badminton sets), 40% (rotating power toothbrushes), and 80% (toy stacking blocks)[^6] of the global market share, yet price increases occurred immediately upon retaliation announcements, weeks before any tariffed goods could reach store shelves.
Reciprocal tariffs seem to incentivize retailers to exploit ‘trade war’ narratives for margin expansion. Businesses raise prices immediately upon retaliation announcements, despite holding inventory purchased at pre-tariff rates and with additional tariff-exempt stock already in transit.
During the six-week trade war period, consumers paid elevated prices on pre-tariff inventory, transferring wealth to retailers as windfall profits rather than to governments as tax revenue or to domestic producers as intended protection.
High-visibility trade war threats, whether eventually implemented or not, create perverse incentives for businesses to engage in profit-maximizing behavior, harming consumer welfare more than quiet policy implementation.
Our findings suggest that the broader the announced scope and the more dramatic the public messaging, the greater the social license for coordinated price increases.
Limitations: Our two-week observation window may not capture the long-term price effects of implemented tariffs. Additionally, while unilateral tariffs showed no statistically significant effect, larger sample sizes might detect subtle effects that we cannot identify with current statistical power.
Nevertheless, our findings demonstrate that reciprocal tariffs have a more pronounced and immediate effect on consumer prices than any other trade policy intervention. While risk mitigation may partially explain this behavior, the evidence strongly suggests retailers opportunistically use trade war uncertainty to expand margins at consumer expense.
Key Findings
Finding 1: Trade War Escalation (Liberation Day) Triggered Preemptive Price Increases
Across the 36 analyzed economically impactful events, the aforementioned US-China Trade War (beginning from April 2nd, 2025) was the only time period that produced pronounced changes in prices across 19 of the analyzed categories during our 2 week follow-up period.
These findings are even more striking when compared to non-tariff events, the baseline changes, and unilateral tariffs. Error bars included indicate the potential variation in values.
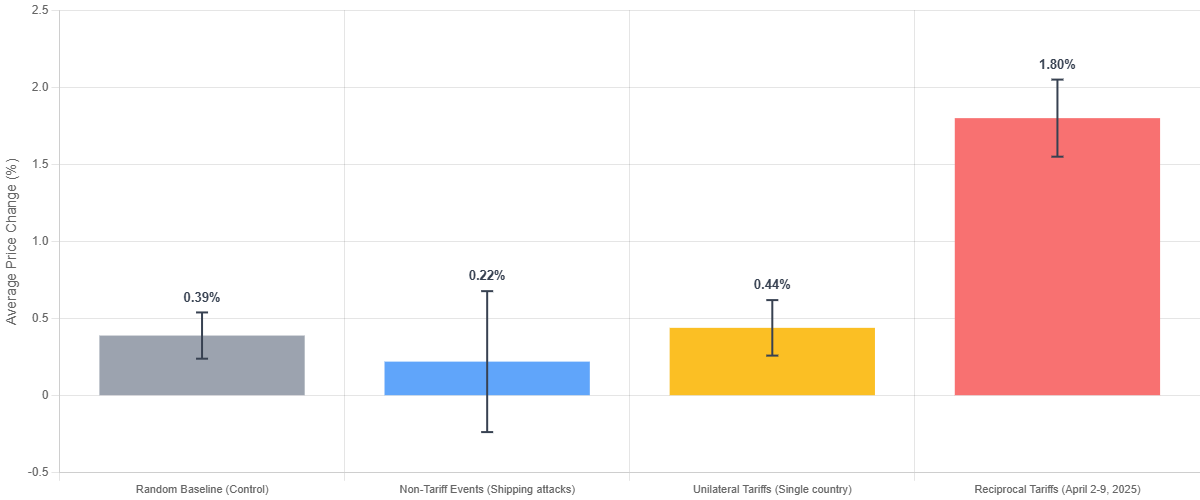 Reciprocal tariff events exert a pronounced influence on US consumer prices
Non-tariff events seem to exert a lower influence on pricing than a random sampling of dates, used as the analytical baseline. But no conclusion can be derived due to the wide confidence interval – we can’t claim that non-tariff events affected prices in either direction.
Additionally, the standard deviation for non-tariff events is substantial, as some categories were highly affected during those periods. Closer analysis revealed that the data includes outliers in both directions (decreases and increases). Increases can be somewhat explained by attacks affecting specific shipping routes – some may be preferred by countries that export a large quantity of a part of our selected categories.
Shipping attacks and the Red Sea Crisis in 2024 were most prominent during the summer months, a period typically associated with seasonal discounting, which may confound the price effect analysis. Therefore, it should not be interpreted that non-tariff events did not affect price, as many confounding factors may influence our data. We decided to include non-tariff data for transparency purposes.
Additionally, given that the Red Sea Crisis caused transit times to increase by up to 47% on some routes and shipping costs to surge, the lack of observable price increases during shipping disruptions may also reflect longer-term inventory buffers and the 2-week observation window being too short to capture supply-driven effects.
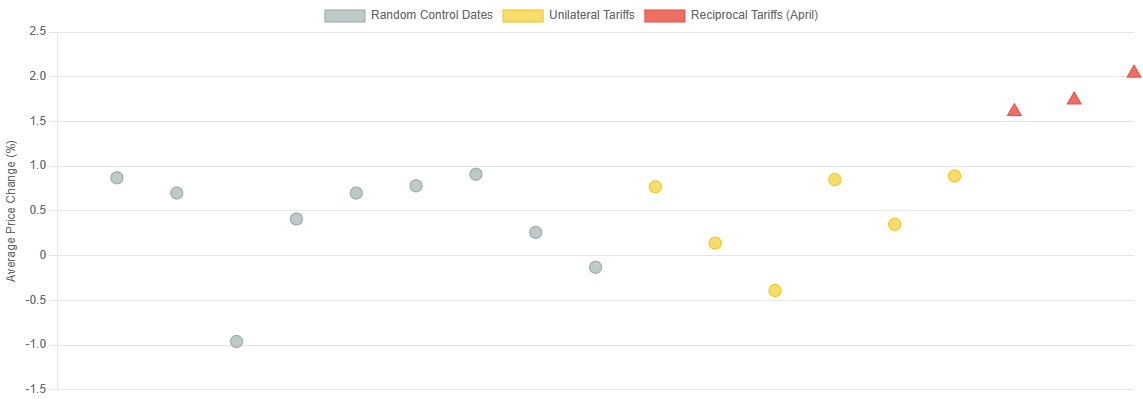 Dots display the start of an event with price change calculated as an average of the 2-week observation period
As seen later, some of the elevated prices revert back to pre-tariff levels or even decrease when compared year-over-year, indicating that the price pressure might have been due to uncertainty – not increased procurement prices.
As such, we conclude that trade war narratives and reciprocal tariffs hurt consumers by giving retailers greater social license to swiftly raise prices, even if there is no underlying supply chain reason (yet). While these effects may eventually be outpaced by actual tariff taxes, at least initially, retailers get the opportunity to capture windfall profits at the cost of the consumer.
Finding 2: The April-May 2025 Trade War Effect
During the US-China reciprocal tariff period (April 2-May 12, 2025), price increases accelerated to 2.04% per 2 weeks. Our baseline, based on random date sampling, was established as being 0.39%.
March 10th represents a unique data point as it was, in fact, the first reciprocal tariff implemented by China against the US. Several factors made us lean towards excluding it from the analyzed period:
- Limited scope and modest levies.
- Early announcement (initial statement made on March 4th).
- Low public visibility.
April 2, 2025, as will be noted later, has significantly greater visibility, larger tariffs, and swifter response.
Reciprocal tariffs during the trade war period elicited a five-fold increase in average 2-week price increases when compared to other periods. Based on our data, the probability of such an increase occurring by random chance is less than 0.1% (p < 0.001)[^7], showing that reciprocal tariffs have a real effect distinct from market noise.
The sharp spike in April 2025 represents the US-China reciprocal tariff period, the only event showing significant deviation from baseline.
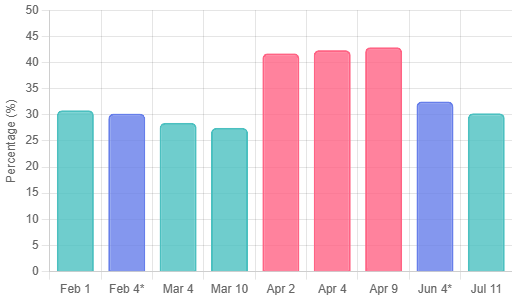
In addition, nearly 43% of all tracked products showed price increases. During all other periods, significantly fewer products experienced price fluctuations as represented by the graph below.
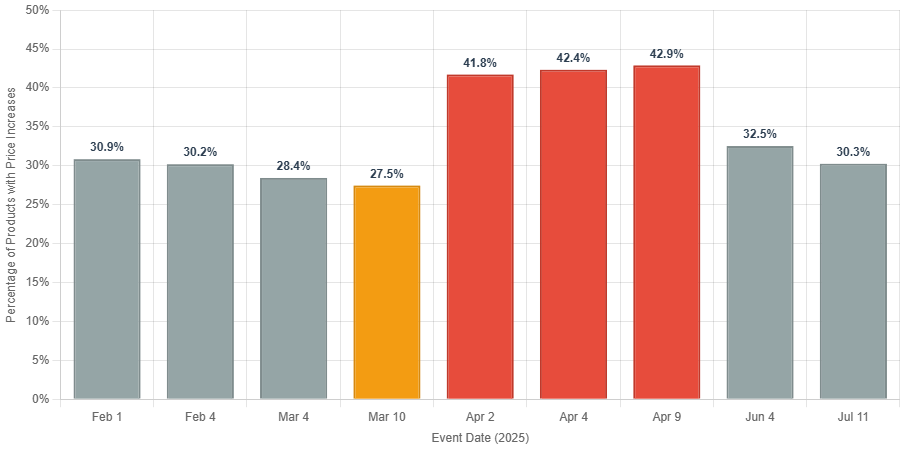 Gray – unilateral tariffs. Orange – first retaliation. Red – trade war period.
Our trade war findings may also be supplemented by extending the price tracking window until May 12th, the day when the US-China trade war subsides due to a mutual agreement.
Such supplementation is insightful as we see a significant slowdown in price changes during June 4th (one of our other tracked events). If our trade war hypothesis is correct, price changes should follow the same trend until May 12th.
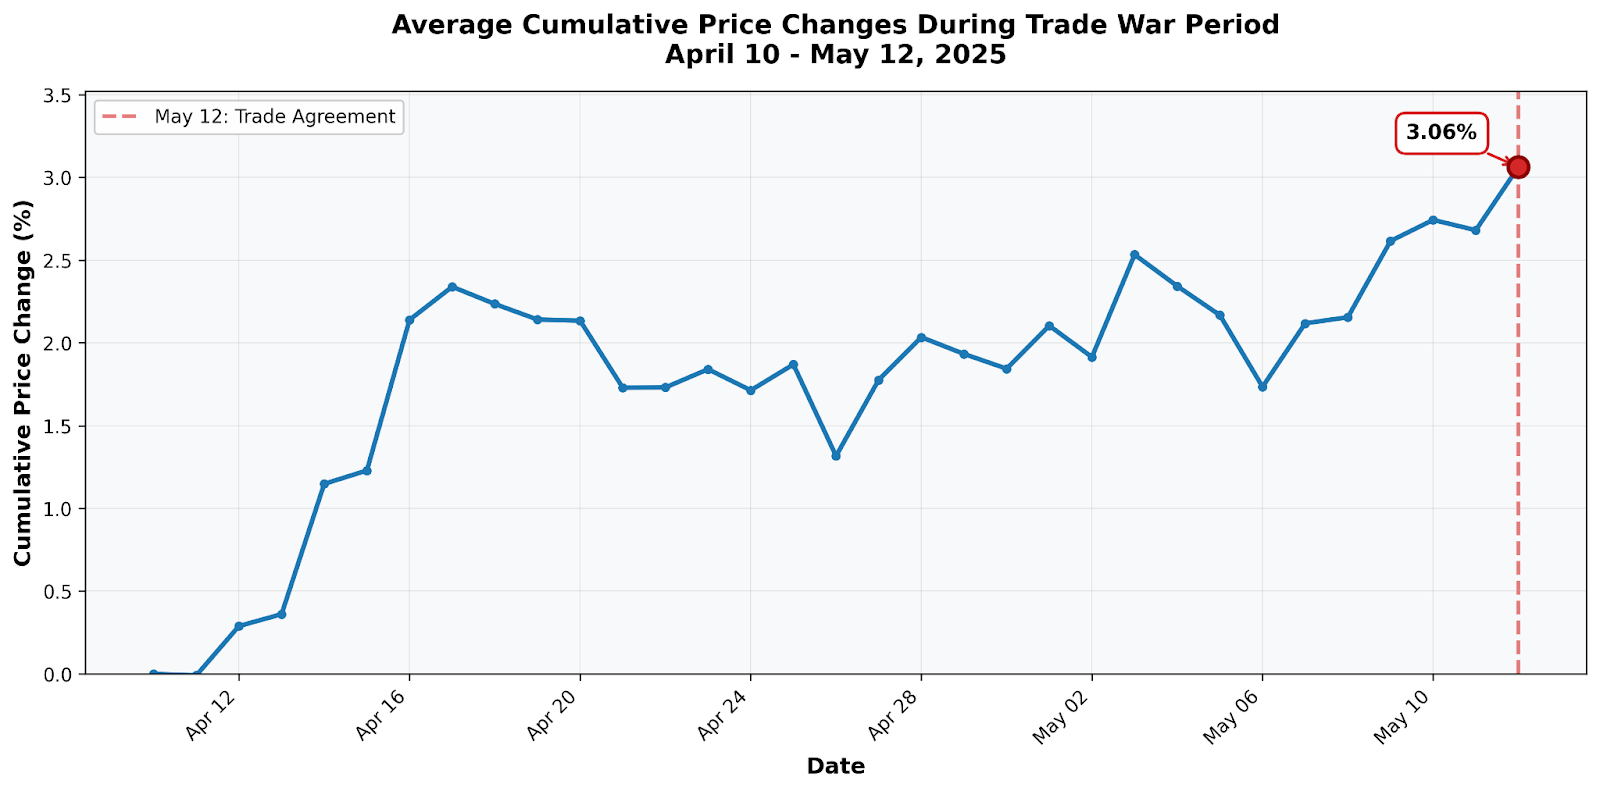 Prices continued to increase at least until May 12th. Calculated by averaging the cumulative price change from baseline (April 10) to each subsequent date across all tracked products.
Since our trade-war data, taken at face value, seems to go against conventional economic theory[^8], we formulated several alternative hypotheses in an attempt to explain or disprove our findings.
Several alternative hypotheses were rejected at the outset: competitive cascade, currency and commodity market effects, credit and payment changes. These would require substantial additional research and, in many cases, would not deny our core findings.
Alternative 1: China’s Export Dominance
China is the world’s top exporter , with the US being its largest partner, accounting for 15% total trade . It would stand to reason that any tariffs implemented by either country could have a comparatively larger effect on prices than tariffs implemented on or by any other country.
Our data, however, includes a short period of time when the US imposed tariffs on China without retaliation, with both countries slowly introducing retaliatory measures:
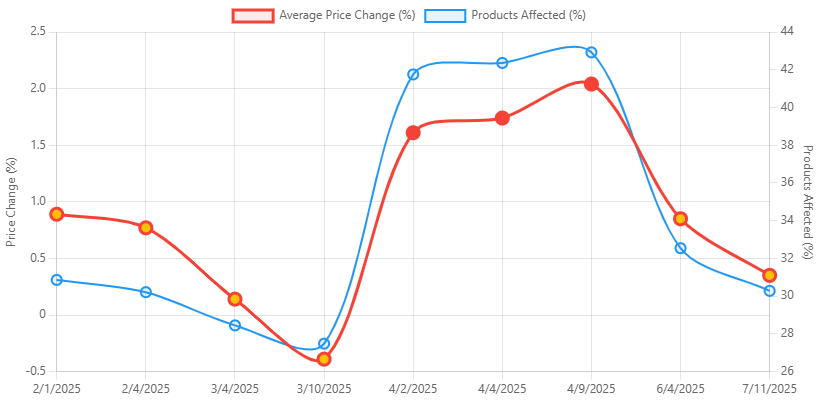
- February 1, 2025. The US announces a 10% tariff on all goods imported from China. China does not respond. An average increase of 0.89% in 2-week prices with 30.86% products affected is noted.
- February 4, 2025. Tariffs announced on February 1st are implemented. No response. An average increase of 0.77% in 2-week prices with 30.21% products affected is noted.
- March 4, 2025. Previously introduced tariffs on goods imported from China increased to 20%. China announces tariffs that will go into effect on March 10th. An average increase of 0.14% in 2-week prices with 28.45% products affected is noted.
- March 10, 2025. China imposes tariffs on the US: 15% on farm goods, 10% on others. A decrease of -0.39% in 2-week prices with 27.48% products affected is noted.
On April 2nd, 2025, the trade war begins in earnest with both countries increasing or threatening tariffs on each other on April 4th, 7th, 9th, and 11th. Various other measures, such as publications of fact sheets, plans on new regulations, etc., are announced until the trade war subsides on May 12th.
If China’s export dominance was the main culprit for the increase in prices, tariffs implemented in early February would likely follow trends found during the US-China trade war period.
Additionally, our dataset includes tariffs imposed on other countries that are major trading partners with the US. If export dominance is the key vector influencing prices, then tariffs implemented on other major trading partners would show a similar pattern, assuming that at least one of the categories in our dataset is a major export good.
We analyzed tariffs imposed on Mexico as one such alternative. Several product categories are imported by the US from Mexico. Since we tracked Amazon product categories, they did not perfectly overlap with customs import definitions.
We selected extension cords as our test case because they belong to a customs category (Insulated Wire, Cable, and Other Insulated Electric Conductors) where Mexico holds clear export dominance over China ( $17.18B vs $3.72B in US imports). If export dominance drives price increases, Mexico tariffs should produce effects comparable to or larger than Chinese tariffs.
When the US imposed 25% tariffs on all Mexican products on February 4th, 2025, extension cord prices rose by 0.66%, which is nearly identical to the 0.61% effect from unilateral Chinese tariffs, and both are statistically indistinguishable from baseline (0.39%).
Despite Mexico’s substantially larger market share in this category, the price effect was no greater than China’s, demonstrating that export dominance alone doesn’t drive significant price increases.
 If export dominance were the determining factor, any tariff on Chinese imports would produce similar effects regardless of retaliation. Our data does not support the thesis: as shown in the figure, unilateral Chinese tariffs (February-March) affected only 27-30% of products with modest price increases (0.61%), while the reciprocal trade war period (April 2-9) affected over 41% of products with significantly larger price increases (1.81%).
Therefore, the discontinuity demonstrates that China’s market position alone cannot explain the trade war’s consumer price effects.
Alternative 2: April 2nd, 2025 – Liberation Day
The US-China trade war commenced on April 2nd, 2025, a highly publicized event dubbed “Liberation Day.” President Donald J. Trump hosted a major media event where he announced and signed an executive order implementing tariffs on nearly every country in the world.
While we cannot quantify publicity directly, it’s reasonable to assume that widespread announcements of sweeping economic policy changes would have a more significant impact on business decision-making than quieter policy implementations.
Liberation Day was an economically unique event due to several factors:
- Broadest scope tariffs in recent years.
- High visibility and publicity.
- “Trade war” framing.
A combination of these factors may have given retailers social license to engage in opportunistic, profit-maximizing behavior.
If publicity were the primary driver, price increases should have been distributed across all tariffed countries receiving equal media coverage. Liberation Day announced tariffs globally, yet our category-specific analysis reveals a clear pattern: products where China holds a major export market share showed dramatically larger price increases than products where China is a weaker competitor.
During the reciprocal tariff period (April 2-9, 2025), categories with high Chinese market dominance showed substantial price increases:
- Toy stacking blocks (80% Chinese market share): 7.14% increase
- Rotating power toothbrushes (40% Chinese market share): 5.89% increase
- Complete badminton sets (45% Chinese market share): 5.38% increase
Even when taking into consideration the general price increase during the period (up to 2.04%), the increases outlined above are still substantial.
While this evidence demonstrates that publicity alone cannot explain our findings, it does suggest that visibility could amplify the effects of reciprocal escalation. The combination of reciprocal retaliation (creating genuine uncertainty and risk) and high publicity (providing social license and consumer expectations) may work synergistically.
Our core finding remains: businesses engage in preemptive price increases during reciprocal tariff periods, with ‘preemptive’ meaning prices rise before tariffed inventory reaches shelves or in response to threats that may not materialize.
Whether driven primarily by escalation uncertainty, amplified by publicity, or some combination thereof, the consumer welfare impact remains negative: retailers capture windfall profits on pre-tariff inventory while consumers pay elevated prices that exceed actual tariff costs.
Alternative 3: Baseline is Too Low
A critical methodological concern is whether our baseline adequately represents “normal” price variation. Ideally, baseline calculations would use periods when no economically impactful events occurred. However, our 36-event dataset leaves few clean windows, and even those might contain unmeasured economic shocks.
Random sampling of dates provides a relatively fair and easily calculated baseline, but such a choice can still be heavily debated. Random samples can still include other economically impactful events; there could be too few data points to get a realistic estimate, our random selection could be skewed due to various other factors, etc.
We addressed this concern through a deliberately conservative robustness test: we recalculated our baseline by including all event periods, knowing this would bias the baseline upward and work against finding significant trade war effects. This “contaminated baseline” approach is methodologically conservative because:
- A larger sample size provides more stable variance estimates and greater statistical power
- Upward bias creates a worst-case scenario — if events typically raise prices (which they do), including them inflates the baseline, making it harder to detect trade war effects
- Strictest possible test — if our findings remain statistically significant against an intentionally inflated baseline, they would certainly hold under any reasonable baseline calculation
Together, these factors create a deliberately conservative test: if our findings retain statistical significance against the inflated baseline, they would certainly hold under any reasonable baseline calculation.
Using all dates in our dataset, our contaminated baseline mean is 0.55% (95% CI [0.53% – 0.57%], calculated from 6,875 day-over-day absolute percentage changes across 19 categories over a full year.
Even with the contaminated baseline, which is 41% higher than our original baseline, the trade war effect remains 3.3 times larger (1.81% vs 0.55%) and highly statistically significant (p < 0.001).
The non-overlapping confidence intervals ([0.53 – 0.57] vs [1.336 – 2.264]) confirm that the trade war effect is distinct from even this inflated measure of normal variation. There is less than 0.1% probability that the observed difference could occur due to random chance.
Notably, the contaminated baseline’s narrow confidence interval [0.53 – 0.57], enabled by the large sample, demonstrates that even when we precisely estimate an intentionally inflated baseline, the trade war effect remains unmistakably distinct
Therefore, our robustness test demonstrates that our findings are not artifacts of baseline selection.
Finding 3: Trade War Price Increases Were Largely Transitory
Tracking price levels from March through September 2025 reveals that trade war-induced price increases were temporary, with median prices fully reverting to pre-war levels and even declining slightly.
| Date | Mean Price Index | Median Price Index |
|---|---|---|
| March 19 (pre-trade war) | 100.0 | 100.0 |
| April 16 (post-spike) | 102.3 | 95.7 |
| May 12 (trade war end) | 100.4 | 98.0 |
| June 15 (1 month after) | 104.0 | 95.0 |
| September 15 (5 months after) | 122.4 | 95.3 |
The median price index (more robust to outliers, which we did find during category-level analysis) shows that typical product prices declined 4-5% below pre-trade war baselines by September 2025. The April trade war spike (+2.3% mean) had fully dissipated by May, and prices continued declining through the summer.
The divergence between mean and median indices by September (122.4 vs 95.3) reveals that a small number of product categories experienced extreme price increases unrelated to the trade war. Specifically, laser computer printers (+19.9%) drove the mean upward, likely reflecting supply chain issues specific to that category rather than lingering trade war effects.
| Category | Average price change (%) between August 2024 and September 2025 | % of products that increased in price |
|---|---|---|
| Laser Computer Printers | 19.9 | 92.05% |
| Rotating Power Toothbrushes | 8.9 | 44.64% |
| Balance Boards | 8.6 | 66.15% |
| Toy Stacking Block Sets | 4.8 | 49.35% |
| Multivitamins | 4.6 | 55.95% |
| Home Automation Hubs & Controllers | 3.7 | 40.00% |
| eBook Readers | 3.6 | 59.65% |
| Extension Cords | 3.3 | 44.12% |
| Skin Care Sets & Kits | 2.7 | 50.00% |
| Complete Badminton Sets | 2.3 | 42.86% |
| Countertop Blenders | 2.2 | 56.45% |
| Basic Office Calculators | 0.3 | 44.44% |
| LED & LCD TVs | -0.04 | 37.04% |
| Basic Crates | -1.2 | 33.33% |
| Office Tape Dispensers | -1.6 | 40.00% |
| AAA Batteries | -1.8 | 35.06% |
| Handheld Vacuums | -2.1 | 38.71% |
| Makeup sets | -3.1 | 34.92% |
| Pet Cameras & Monitors | -5.4 | 34.48% |
While some categories like laser printers, toothbrushes, and balance boards showed substantial year-over-year increases, these appear driven by category-specific factors rather than retained trade war premiums. Meanwhile, 7 of 19 categories (37%) experienced outright price declines from March to September, indicating that the trade war premium did not persist across the product portfolio.
Unlike the immediate trade war period, when retailers systematically raised prices across product categories (43% of products affected), the post-trade war period shows no evidence of sustained price premiums. Median prices fell below pre-war levels, suggesting:
- The trade war spike was driven by temporary opportunistic behavior rather than genuine cost pressures
- Competitive market forces reverted price hikes
- Retailers captured windfall profits primarily during the 2-month conflict window, not through sustained premiums
The September mean price surge appears to reflect idiosyncratic supply issues in specific categories (notably laser printers) rather than persistent trade war effects. When controlling for outliers via median analysis, the data shows price reversion within 3 months of the trade war’s conclusion.
“Our US shipping operations indicate turbulence in the customs system, especially after the De Minimis exemption removal. These changes have introduced confusion across the board, and we’re seeing customs charges vary monthly for identical product categories. These inconsistencies suggest the underlying processes are still evolving.” Ignas Dirma, Head of Digital at Pando Moto
Conclusions
Our analysis of 1,900 products across 19 categories through the period of September 2024 to August 2025 revealed how retailers respond to trade policy, challenging some assumptions about tariff effects on prices.
Findings indicate that only the reciprocal US-China trade war period (April 2-May 12, 2025), an event characterized by unprecedented scope, high visibility, and explicit “trade war” framing, triggered statistically significant preemptive price increases reaching up to 2.04% per two weeks.
In contrast:
- Unilateral tariffs on China (February-March 2025) produced no significant price effects (0.61%), statistically indistinguishable from baseline)
- China’s initial retaliation (March 10) showed negligible impact (-0.39%)
- Tariffs on other major exporters (Mexico) similarly produced baseline-level effects (0.66%)
The trade war period exhibited several unique characteristics that may have enabled coordinated price increases:
- Reciprocal escalation: Mutual retaliation created genuine supply chain uncertainty
- Unprecedented scope: Tariffs affected nearly all trading partners simultaneously
- High visibility: Liberation Day and subsequent announcements ensured universal awareness
- “Trade war” narrative: Media framing created expectations of sustained disruption
Therefore, it is likely that the combination of factors listed above gave retailers social license to engage in profit-maximizing behavior. When 43% of products across unrelated categories simultaneously increase in price, individual retailers face minimal competitive disadvantage. As such, the “trade war” narrative provides collective cover for margin expansion.
Evidence of opportunistic pricing:
Several patterns indicate price increases were preemptive rather than cost-driven:
- Timing precedes costs: Prices rose immediately upon announcement, weeks before tariffed goods could reach shelves
- Inventory buffer: Retailers typically hold 30-90 days of stock purchased at pre-tariff rates
- Grace period: Goods en route remained tariff-exempt, providing additional lower-cost inventory
- Product category patterns: Price increases concentrated in Chinese-export-heavy categories, inconsistent with publicity-only explanations but consistent with China-specific retaliation dynamics
Price persistence analysis:
Tracking median price levels from March through September 2025 reveals that trade war-induced increases were largely transitory. Median prices declined to 95.3% of pre-trade war levels by September, indicating reversion and even modest deflation across typical products.
The mean price index (122.4) diverged significantly from the median (95.3) due to extreme increases in a few outlier categories (notably laser printers at +19.9%), which appear driven by category-specific supply factors unrelated to the trade war.
Policy Implications
Our findings reveal an underappreciated mechanism of trade conflict costs: opportunistic pricing during high-visibility escalation periods imposes immediate consumer welfare losses that may exceed the eventual cost of implemented tariffs.
During the six-week trade war period, consumers paid elevated prices on pre-tariff inventory, transferring wealth to retailers as windfall profits rather than to governments as tax revenue or to domestic producers as intended protection.
The transitory nature of most price increases suggests these premiums were opportunistic rather than justified by genuine cost pressures.
Critical factors enabling opportunistic behavior:
- Reciprocal escalation creates supply chain uncertainty and justifies price increases
- High visibility provides social license and consumer expectations of rising costs
- “Trade war” framing offers collective cover for coordinated pricing across competitors
- Broad scope (many countries/products) allows simultaneous increases without competitive disadvantage
Notably, unilateral tariffs, even when publicly announced and targeting major trading partners, produced no significant price effects when not accompanied by retaliation and escalation dynamics.
Limitations:
Our two-week observation windows may not capture long-term tariff effects. Additionally, we cannot fully isolate the independent effects of (1) reciprocal escalation, (2) publicity, and (3) trade war framing, as these factors occurred simultaneously during Liberation Day. However, the concentration of price increases in Chinese-export-heavy categories suggests retaliation dynamics played a key role beyond mere publicity.
Implications for policymakers:
Trade conflicts create opportunities for opportunistic pricing that harm the very consumers such policies often claim to protect. The manner of trade policy implementation (particularly whether it triggers reciprocal escalation and dramatic public framing) may matter as much as the substance of the policy itself for immediate consumer welfare impacts.
Policymakers should recognize that preventing escalation into reciprocal trade wars may be more important for protecting consumer welfare than the specific tariff levels implemented, as our data shows unilateral tariffs produced minimal price effects even when targeting dominant exporters.
Our further research will evaluate the long-term speed and strength of tariff pass-through, as numerous tariffs implemented during this period have now been in effect long enough to assess their sustained impact on consumer prices beyond the immediate opportunistic pricing we documented here.
Appendix I: Selected Events
Tariff Events
This appendix provides a comprehensive list of all tariff and non-tariff events analyzed in this study. Events are organized chronologically and categorized by type.
| Date | Event Type | Description | Target Countries/Regions |
|---|---|---|---|
| 20-Jan-2025 | Announced | 25% tariffs on all imports scheduled to begin February 1 | Canada, Mexico |
| 26-Jan-2025 | Announced | 25% tariffs escalating to 50% within one week (later reversed) | Colombia |
| 1-Feb-2025 | Announced | 25% tariffs on all imports; 10% tariff on all imports | Canada & Mexico; China |
| 4-Feb-2025 | Imposed | 10% tariff on all Chinese imports implemented | China |
| 10-Feb-2025 | Announced | 25% tariffs on foreign steel and aluminum | Global |
| 14-Feb-2025 | Announced | Tariffs on foreign automobiles planned for April 2 | Global |
| 27-Feb-2025 | Announced | Confirmed tariffs on all imports to commence March 4 | Canada, Mexico, China |
| 4-Mar-2025 | Imposed | Previously announced tariffs implemented | Canada, Mexico, China |
| 6-Mar-2025 | Announced | 25% tariffs on steel and aluminum effective March 12 | Global |
| 10-Mar-2025 | Imposed | First reciprocal tariff: China imposed 15% on US agricultural products, 10% on other goods; Ontario imposed 25% electricity surcharge | China, Canada (Ontario) |
| 12-Mar-2025 | Announced | Retaliatory tariffs announced by EU and Canada; EU tariffs effective April 1 | EU, Canada |
| 13-Mar-2025 | Announced | EU announced 50% tariff on US whiskey and additional products effective April 1 | EU |
| 24-Mar-2025 | Announced | 25% tariffs on oil imports effective April 2 | Venezuela |
| 26-Mar-2025 | Announced | 25% tariff on all imported automobiles and automotive parts | Global |
| 2-Apr-2025 | Imposed | 10% baseline tariff on all imports plus country-specific reciprocal tariffs | Global |
| 4-Apr-2025 | Imposed | China imposed 34% retaliatory tariff on US goods | China |
| 5-Apr-2025 | Announced | 46% tariff announced (Vietnam requested implementation delay) | Vietnam |
| 7-Apr-2025 | Announced | Threatened additional 50% tariff on Chinese imports | China |
| 9-Apr-2025 | Imposed | US tariffs: China 104%, EU 20%, Japan 24%, Vietnam 46%; China added 50% retaliatory tariff | China, EU, Japan, Vietnam |
| 9-Apr-2025 | Imposed | US paused reciprocal tariffs on all countries except China; raised China tariff to 125% | China (exception); Global (pause) |
| 10-Apr-2025 | Announced | China’s cumulative tariff rate clarified as 145% (10% + 20% + 50% + 65%) | China |
| 13-Apr-2025 | Announced | Tariffs on semiconductor imports forthcoming | Global |
| 4-Jun-2025 | Imposed | Steel and aluminum tariffs increased from 25% to 50% | Global |
| 9-Jul-2025 | Announced | 50% tariff on copper imports; 50% on all imports; 20%+ on 21 countries; effective August 1 | Copper (global); Brazil; 21 specified countries |
| 11-Jul-2025 | Announced | 30% tariffs on all imports effective August 1 | EU, Mexico |
Note: The US-China trade war period (April 2-May 12, 2025) is highlighted above. This period exhibited the most significant price increases across tracked categories.
Non-tariff Events (June - July 2024)
All non-tariff events relate to Houthi attacks and military responses in the Red Sea and Gulf of Aden during the Red Sea Crisis. These events were used as a control group to assess whether supply chain disruptions absent tariff policy affect consumer prices.
Some events overlap with the Twelve-Day War (Iran-Israel) as well.
| Date | Event Type | Description |
|---|---|---|
| 3-Jun-2024 | Missile Interception | Israel intercepted Houthi ballistic missile fired toward Eilat |
| 4-Jun-2024 | Missile Launch | Houthis launched 2 anti-ship ballistic missiles into Red Sea shipping lanes |
| 6-Jun-2024 | UAS/USV Destruction | US forces destroyed 8 unmanned aerial systems (UAS) and 2 unmanned surface vessels (USV); coalition forces engaged 1 additional UAS; 1 missile launched at commercial shipping |
| 7-Jun-2024 | Missile & Vessel Attack | Houthis launched 4 missiles at commercial vessels; US forces destroyed 4 UAS, 2 missiles, and 1 Houthi patrol boat |
| 9-Jun-2024 | Missile Strike & Defense | Houthis attacked commercial vessels M/V Tavvishi and M/V Norderney; US forces destroyed UAS and cruise missiles |
| 12-Jun-2024 | Missile & USV Attack | US forces destroyed 3 missile launchers and 1 UAS; Houthis launched 2 missiles and struck M/V Tutor |
| 13-Jun-2024 | Missile & Vessel Attack | Houthis attacked M/V Verbena; US forces destroyed radar sites, USVs, patrol boats, and UAS; Houthis launched 2 additional missiles at commercial shipping |
| 23-Jun-2024 | UAS Attack | Houthis attacked M/V Trans World Navigator with UAS, causing minor crew injuries |
| 8-Jul-2024 | Drone Attack Claim | Houthis and Iraqi militant groups claimed drone attack on Eilat; IDF intercepted suspicious aerial object |
| 19-Jul-2024 | Drone Attack | Houthis launched drone strike on Tel Aviv, killing 1 civilian; second drone intercepted by air defense |
| 21-Jul-2024 | USV Destruction & Missile Interception | US forces destroyed 4 USVs in Red Sea; Houthis launched missile toward Eilat, successfully intercepted |
Note: While Red Sea Crisis-related incidents continued into 2025, the frequency and intensity of attacks on commercial shipping decreased substantially by autumn 2024. Our analysis focuses on the June-July 2024 period when disruptions were more acute.
Appendix II: Median Values
Selected Events
| Median Change (%, all categories) | Event Date |
|---|---|
| 1.2 | 2/1/2025 |
| 1.3 | 2/4/2025 |
| 0.4 | 3/4/2025 |
| -0.5 | 3/10/2025 |
| 1.8 | 4/2/2025 |
| 1.9 | 4/4/2025 |
| 2.4 | 4/9/2025 |
| 1.1 | 6/4/2025 |
| 0.7 | 7/11/2025 |
Random Dates (Baseline)
| Median Change (%, all categories) | Event Date |
|---|---|
| 1.2 | 1/27/2025 |
| 1.1 | 2/27/2025 |
| -0.5 | 3/16/2025 |
| 0.9 | 4/21/2025 |
| 0.9 | 5/20/2025 |
| 1.1 | 6/8/2025 |
| 1.2 | 6/15/2025 |
| 0.5 | 7/12/2025 |
| -0.2 | 8/29/2025 |
Contaminated baseline median: 0.32%
Footnotes
- [^1] See W. Poole’s Free Trade: Why Are Economists and Noneconomists So Far Apart?
- [^2] Researchers are not affiliated with or funded by Keepa.
- [^3] Imposition of tariffs generally include grace periods for goods already *en route *to a point-of-entry. See, for example, White & Case’s analysis .
- [^4] Pando Moto is a premium motorcycle gear retailer with US being one of the company’s primary export markets.
- [^5] While the trade war has not formally ended, numerous exemptions and delays have been introduced with the proposed end of the grace period being November 10th, 2025.
- [^6] Data provided is for toys in general, however, if the entire category is so heavily dominated by China, it is highly likely that exports of specific toys are also dominated by the same country.
- [^7] True p value even lower – we omitted a large number of zeroes for brevity.
- [^8] Tariffs applied by China to US imports would, if at all, raise prices for consumers in China, not in the US.