'/%3e%3cellipse%20opacity='0.34'%20cx='327.5'%20cy='339'%20rx='264.5'%20ry='264'%20fill='url(%23paint1_linear_12724_35442)'/%3e%3cdefs%3e%3clinearGradient%20id='paint0_linear_12724_35442'%20x1='327'%20y1='-2.524e-06'%20x2='327'%20y2='389.286'%20gradientUnits='userSpaceOnUse'%3e%3cstop%20stop-color='%2327D9E5'/%3e%3cstop%20offset='0.927406'%20stop-color='%23004047'%20stop-opacity='0'/%3e%3c/linearGradient%3e%3clinearGradient%20id='paint1_linear_12724_35442'%20x1='328.02'%20y1='74.7771'%20x2='328.02'%20y2='395.312'%20gradientUnits='userSpaceOnUse'%3e%3cstop%20stop-color='%2327D9E5'/%3e%3cstop%20offset='0.927406'%20stop-color='%23004047'%20stop-opacity='0'/%3e%3c/linearGradient%3e%3c/defs%3e%3c/svg%3e)
IPRoyal Research: Price Sensitivity, Competitor Tracking & Digital Solutions
Product news
Karolis Toleikis
Current global supply chain turbulence, political factors, and swiftly evolving economic conditions have placed enormous pressure on businesses in nearly every industry. IPRoyal decided to conduct a survey, querying executives and managers to better understand how these factors affect business decision-making.
A total of 675 individuals across more than 17 industries participated in the survey. Since the survey was conducted with a focus on retail and ecommerce, some industries received no respondents.
The following terms are used to represent data:
- Answers (%) - the share of all answer selections that a particular choice represents.
- Respondents (%) - the share of individuals who selected that choice out of the total number of individuals who answered the question.
- Counts - numerical answer values.
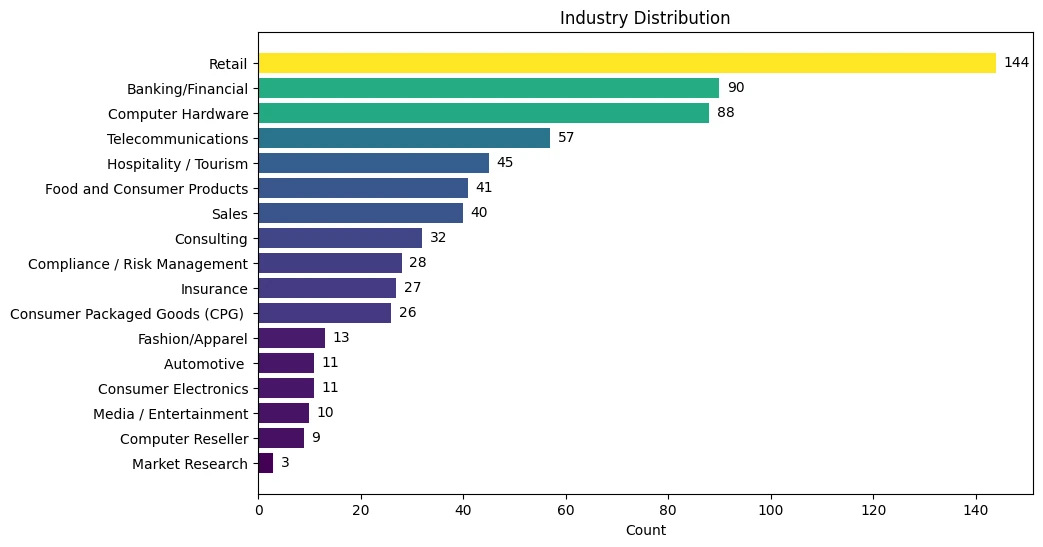
The majority of our data has been acquired from the retail, banking, computer hardware, telecommunications, and hospitality industries. The top five industries account for 424 out of 675 answers, which is 62.81%.
Many of these industries are more closely tied to business-to-consumer (B2C) rather than business-to-business (B2B); therefore, many of our findings more closely track B2C pain points, solutions, and rising issues.
Online Sales Greatly Influence Revenue
Respondents were queried how much revenue, percentage-wise, their business acquires from online channels. Digitally procured revenue has numerous benefits, such as allowing easier access to wider markets, but it also has unique drawbacks, such as increased competition.
Our goal was to evaluate the challenges and solutions faced by businesses with a strong online presence. While we surveyed many more participants, our screening questions removed participants who checked less than 10% for online-generated revenue and those who checked not sure.
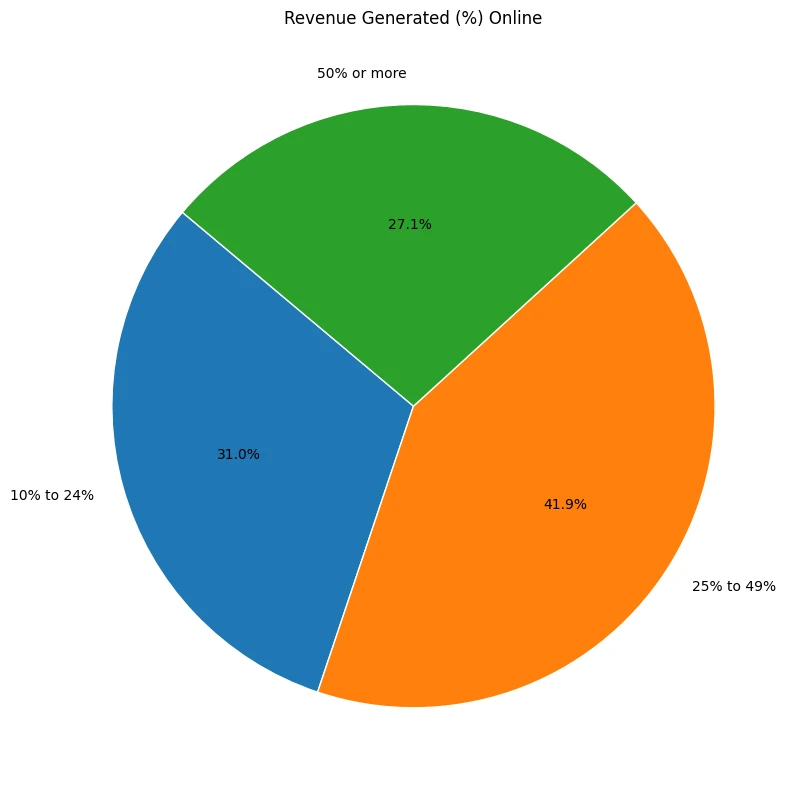
As shown in the chart above, more than a quarter of answers indicate online channels generate 50% or more of total revenue. The slight majority of our answers indicated that online channels generate between a quarter (25%) and up to half of total revenue.
Online Revenue by Industry
The above data shows aggregated values across all industries. However, there are some industry-specific differences hidden deeper in our dataset.
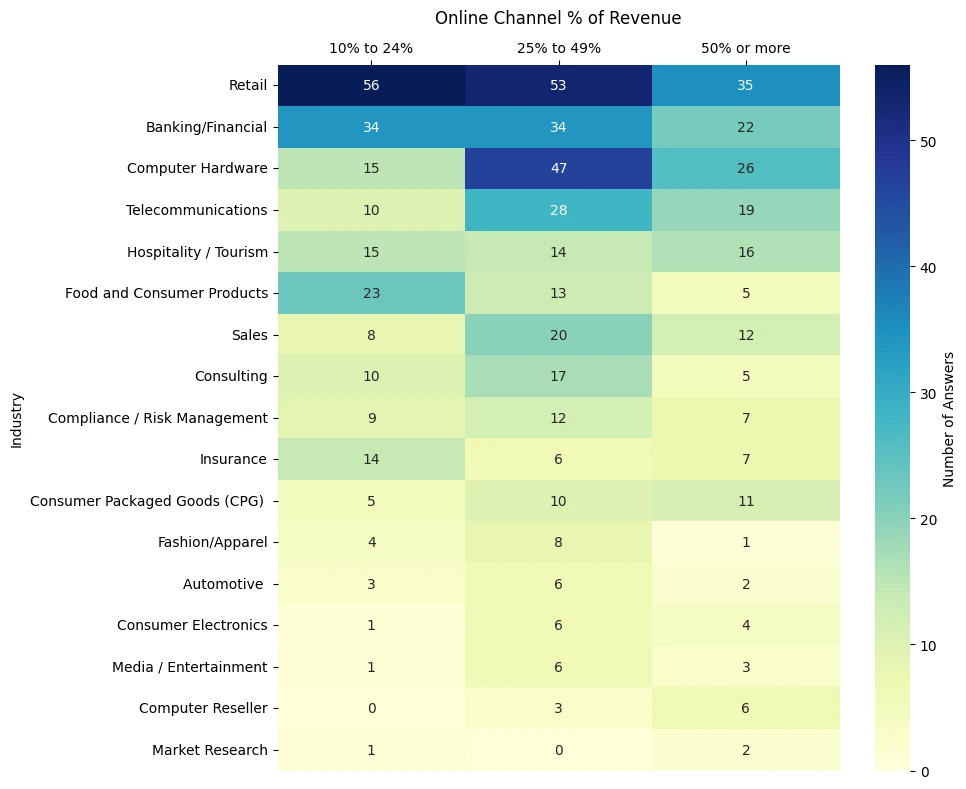
A majority of industries report that online sales make up the lower end of revenue (10% to 24%), with a nearly identical fraction going towards the 25% to 49% bucket. Only a few industries have outliers in the 50% or more revenue bracket.
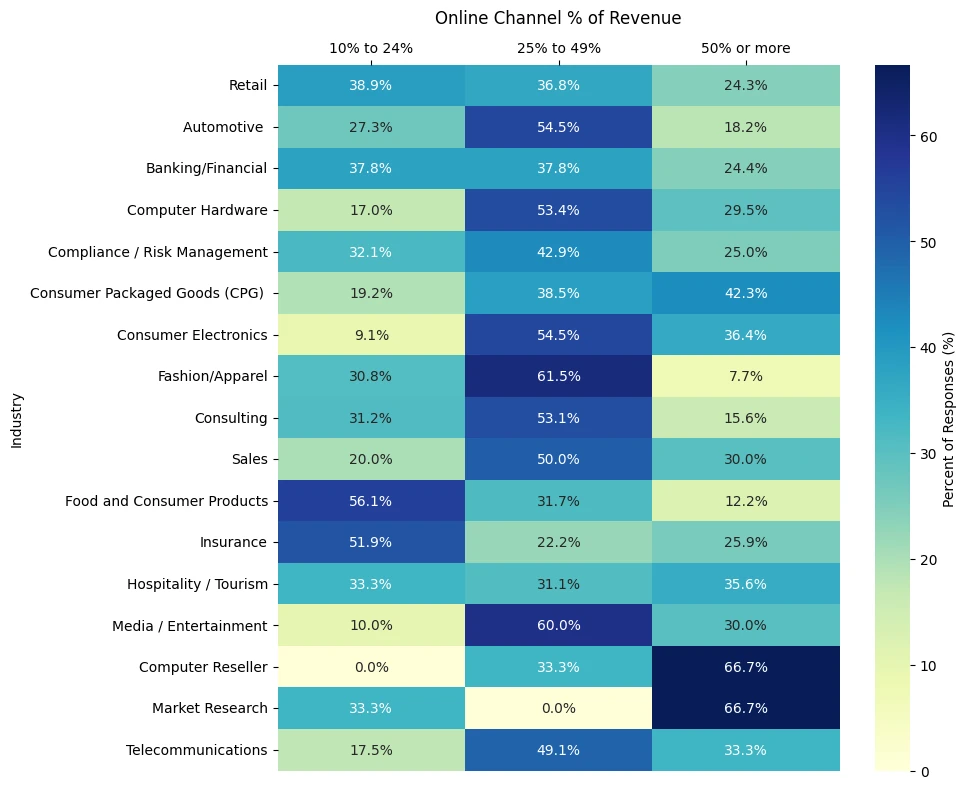
One slight outlier is the Consumer Packaged Goods (CPG) segment, which has the highest percentage of companies indicating that they generate 50% or more of their revenue through online channels.
Some caution is advised for industries such as Market Research, Computer Reseller, and others, wherein respondents were relatively few. These are highly likely not representative of the total population sample (industry), as there’s simply too little data to make any informed decision.
Additionally, while the percentages in the bottom categories look impressive, they’re much more susceptible to randomization issues, statistical variance, and general class imbalance.
Economic Factors & Pricing
It’s no secret that external economic factors influence business decision-making. One of the first reflections of changing economic circumstances is price changes.
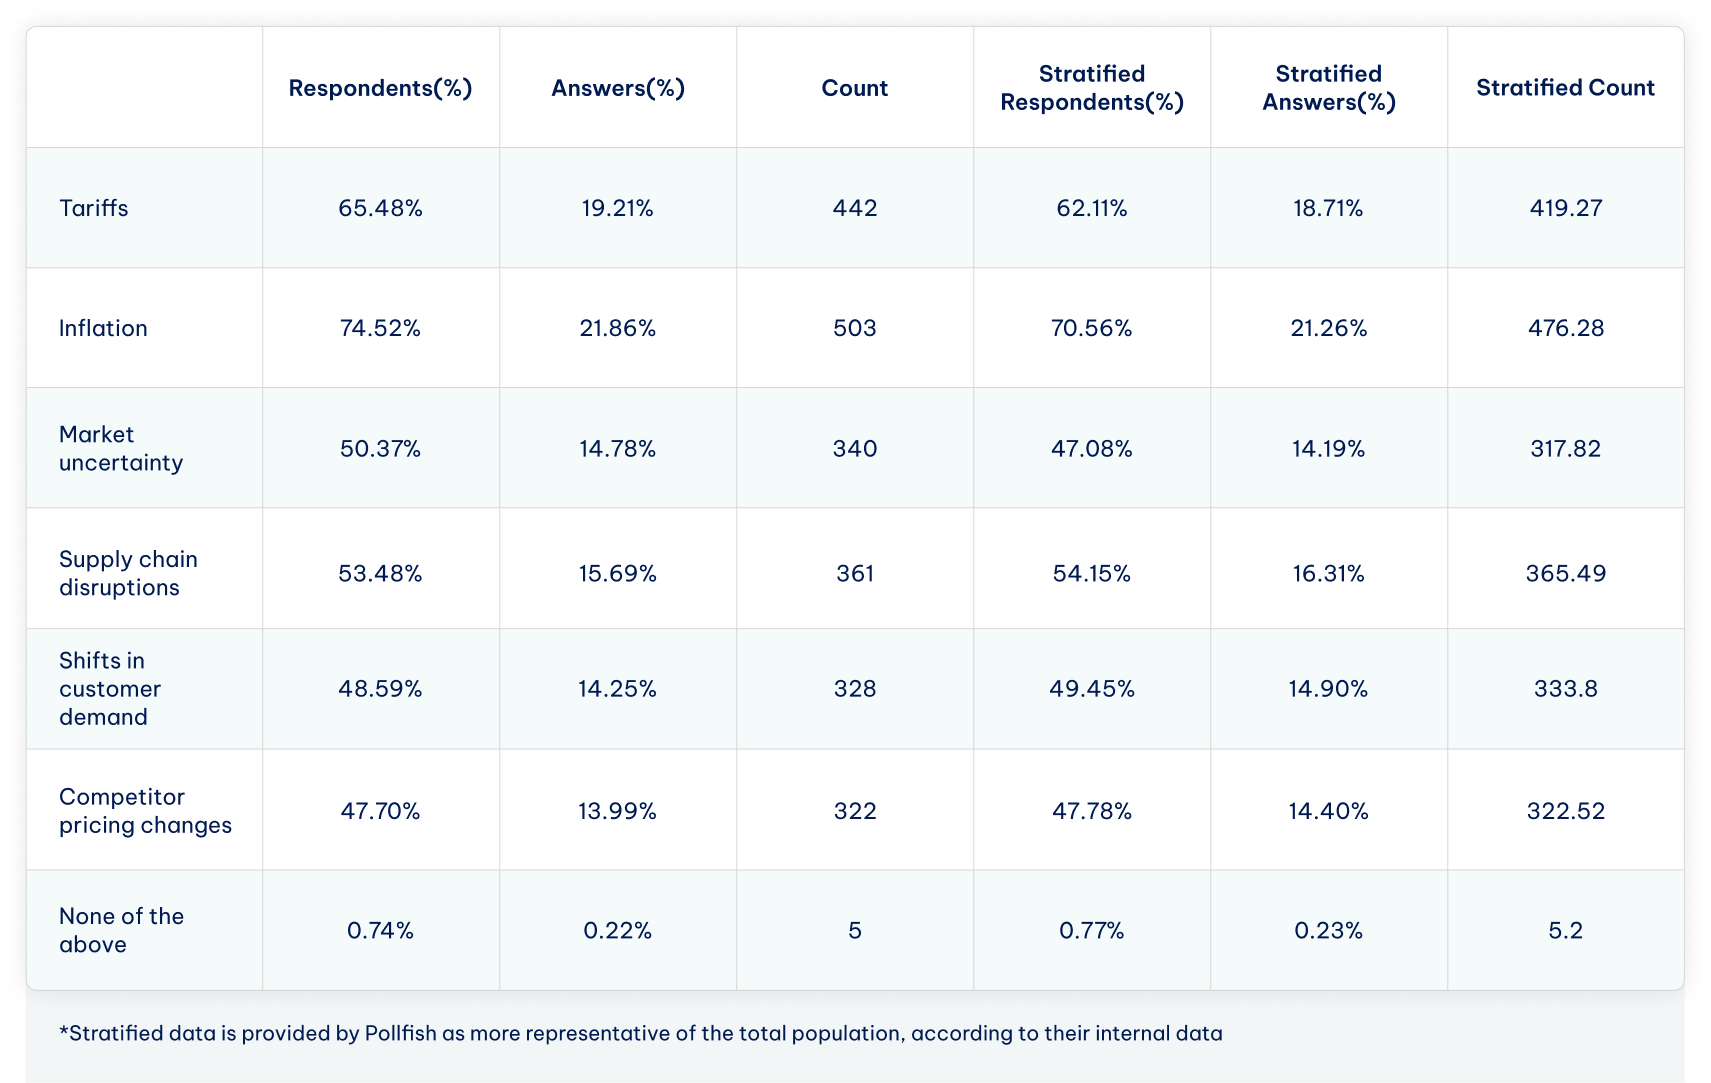
We surveyed our respondents on various economic factors that influence their prices. Tariffs (65% of respondents, ~20% of answers) and inflation (74.5% of respondents, ~22% of answers) were listed as the most important factors.
Competitor pricing changes were listed at the bottom of the priority list (outside of the answer None of the above), albeit all of the answers except for Inflation are extremely close to each other in importance.
Part of the reason could be due to our respondents seeing price sensitivity as playing an essential role in their industry – over 90% said that price plays an important role, with 30.22% stating that even small changes significantly impact buying decisions.
| Answers | Answers (%) | Count | Stratified Answers (%) | Stratified Count |
|---|---|---|---|---|
| Extremely price-sensitive — small changes significantly impact buying decisions | 30.22% | 204 | 27.05% | 182.58 |
| Moderately price-sensitive — price plays a role but is not the sole factor | 64.59% | 436 | 66.12% | 446.28 |
| Minimally price-sensitive — other factors (e.g., brand loyalty, quality) outweigh price | 5.19% | 35 | 6.84% | 46.14 |
Price sensitivity seems to vary little across industries, with the exception of Consumer Electronics, Telecommunications, and Computer Reseller – all of these accounted for the majority of the Extremely price-sensitive answers in our dataset.
Investigating industry specifics for economic factors showed some deviations from the norm. For example, Market Research is the only industry that indicated that inflation does not influence pricing (0 respondents in total).
Additionally, Retail has shown to be the most sensitive to competitor pricing, with 74 respondents. The closest runner-ups are Computer Hardware (41 respondents) and Banking (38 respondents).
Finally, we truncated the entire dataset to determine which economic factors affected specific industries the most.
| Industry | Factor | Percentage |
|---|---|---|
| Automotive | Inflation | 81.8% |
| Banking/Financial | Inflation | 82.2% |
| Compliance / Risk Management | Inflation | 78.6% |
| Computer Hardware | Inflation | 71.6% |
| Computer Reseller | Inflation | 77.8% |
| Consulting | Inflation | 68.8% |
| Consumer Electronics | Tariffs | 90.9% |
| Consumer Packaged Goods (CPG) | Supply chain disruptions | 76.9% |
| Fashion/Apparel | Tariffs | 100.0% |
| Food and Consumer Products | Supply chain disruptions | 75.6% |
| Hospitality / Tourism | Inflation | 73.3% |
| Insurance | Inflation | 70.4% |
| Market Research | Market uncertainty | 66.7% |
| Media / Entertainment | Shifts in customer demand | 70.0% |
| Retail | Inflation | 74.3% |
| Sales | Inflation | 85.0% |
| Telecommunications | Inflation | 70.2% |
As we can see, inflation is the most frequently mentioned economic factor with slight specificities that can be noted. Tariffs are the second most influential factor for pricing changes.
Price Reactivity Across Industries
Most of our respondents indicated that they use a proactive pricing strategy wherein data and market insights are used to adjust prices (70% of answers, 68.58% stratified). Only a minor number of respondents indicated that their prices remain static (4.30% of all answers).
Interestingly, a majority of those who responded with static are from either Food and Consumer Products (7 respondents) or Retail industries (7 respondents) – those that are often most susceptible to competitor pricing.
Nonetheless, many companies still consider price tracking an essential business element. We asked respondents whether their company factors in competitor pricing when setting their own prices to determine how important price adjustments are to their core business.
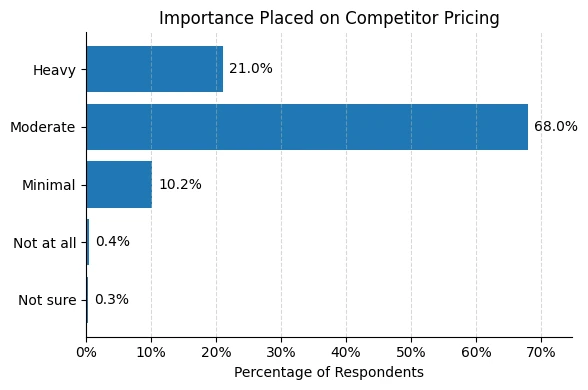
Almost all businesses in our dataset perform some level of competitor price tracking with moderate levels of intensity (competitor pricing is one of the key factors), beating out other options by a large margin. Heavy importance (competitor prices are a primary consideration) is placed by slightly over ⅕ of our respondents.
None of the industries showed outliers as moderate intensity was the most popular answer in all industries surveyed when data was aggregated.
Such a deviation from the chart outlined above can be attributed to specific businesses within industries placing more importance on competitor pricing. However, not enough of them exist to indicate industry-wide preferences.
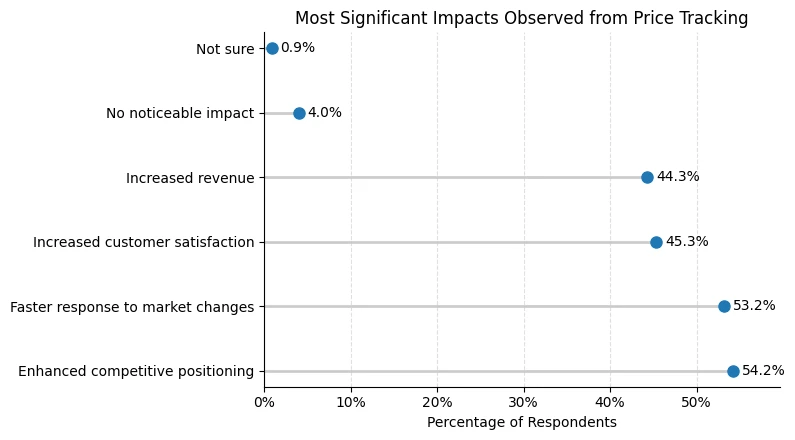
While competitor pricing is far from being the most important factor for all businesses, as shown above, those that do perform price tracking net various positive benefits.
We also investigated whether these answers are affected by tracking intensity (i.e. if heavy tracking is more likely to produce positive results according to respondents).
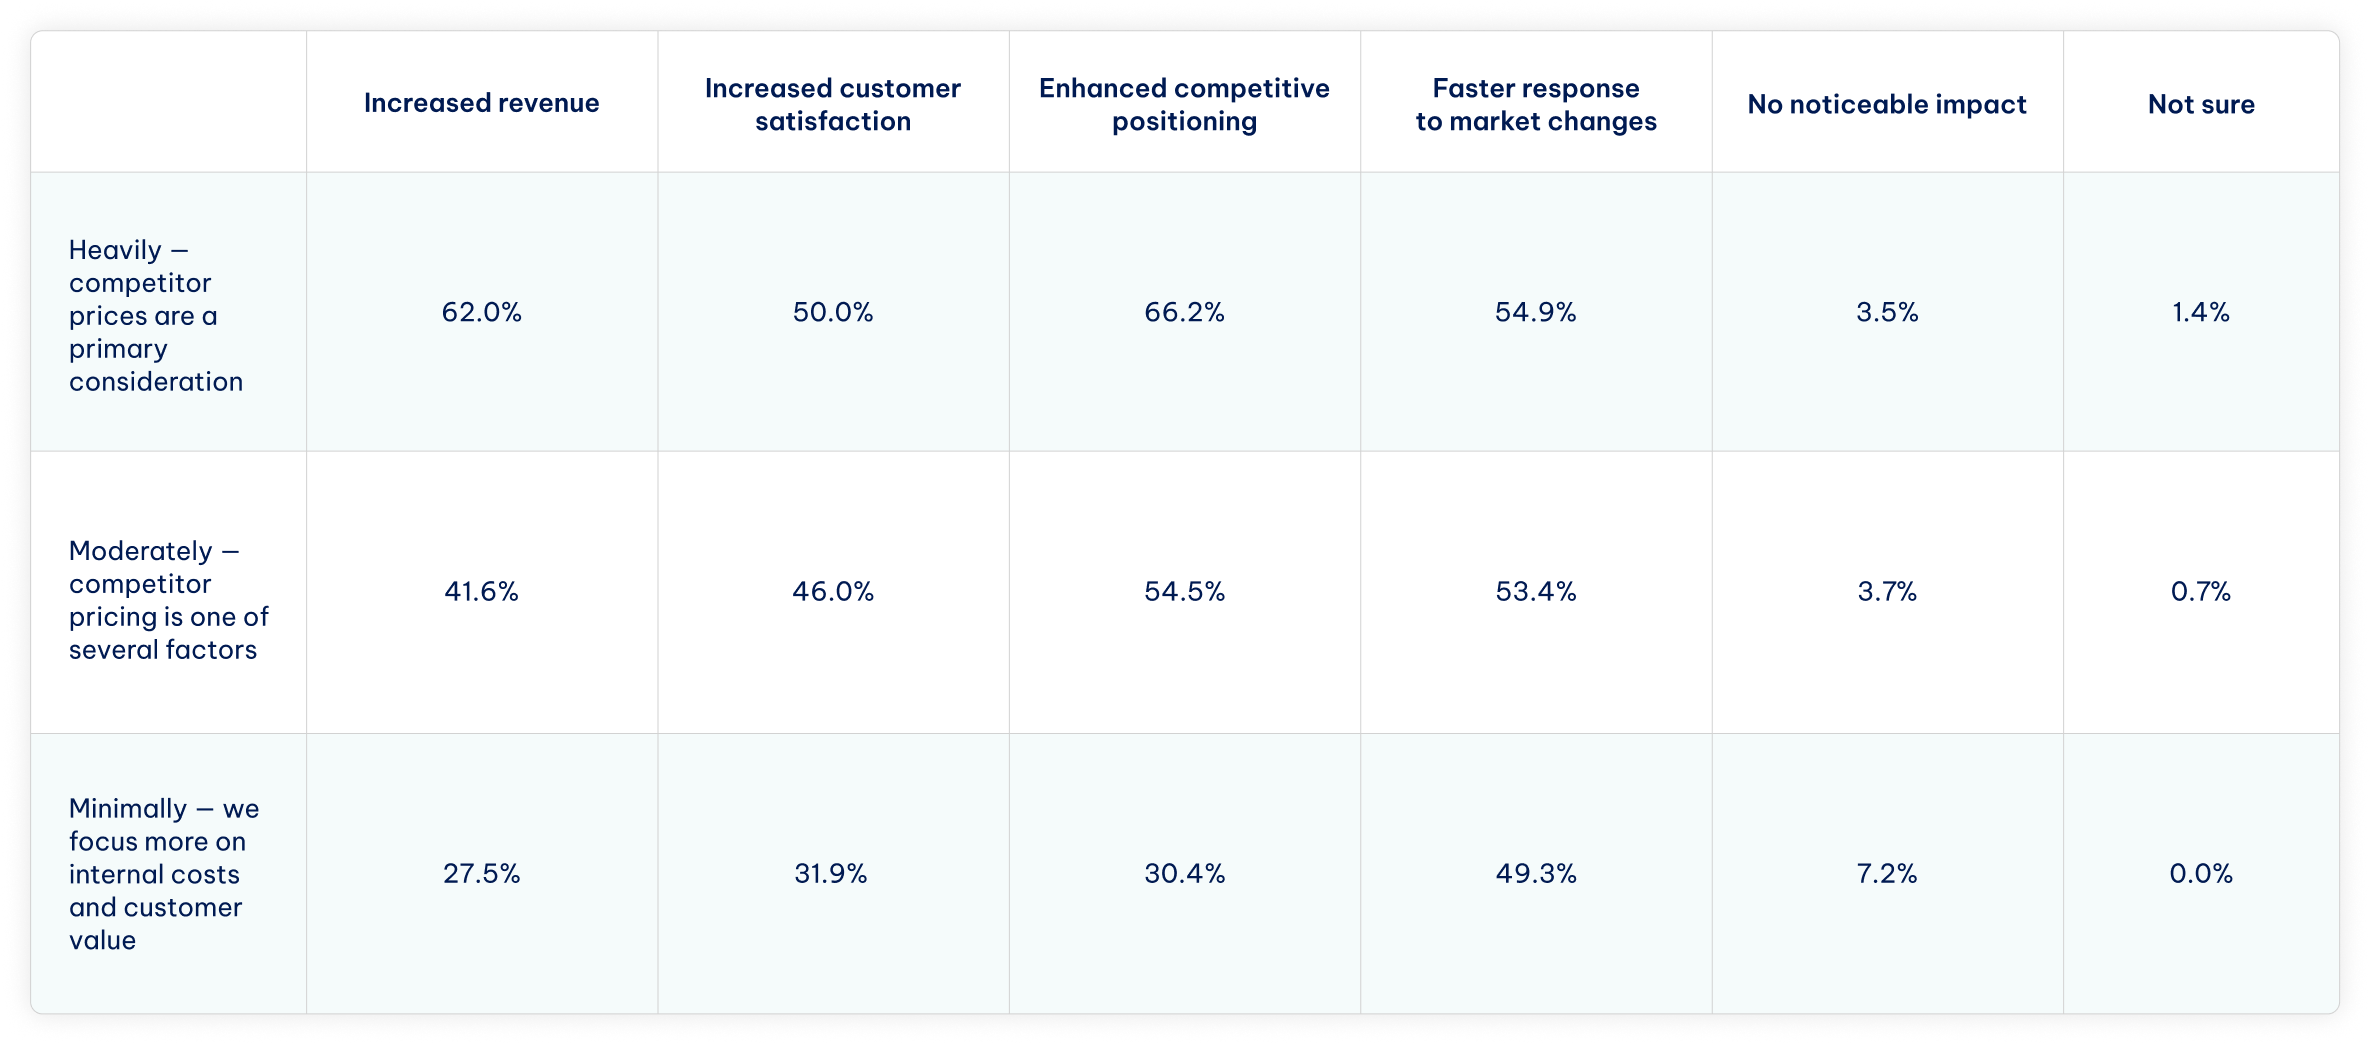
As we can see from the data outlined above, businesses that engage in heavier price tracking are more likely to report increased revenue ( 62% vs. 41.6% vs. 27.5% ), better positioning ( 66.2% vs. 54.5% vs. 30.4% ), and less likely to report no impact ( 3.5% vs. 3.7% vs. 7.2% ).
Statistical analyses also indicate that these factors are correlated. A positive correlation indicates that as tracking intensity increases, so does the associated benefit, with 1 being a perfect correlation (both intensity and benefit move perfectly in tandem).
| Correlation | |
|---|---|
| Increased revenue | 0.21 |
| Increased customer satisfaction | 0.09 |
| Enhanced competitive positioning | 0.19 |
| Faster response to market changes | 0.03 |
| No noticeable impact | -0.04 |
| Not sure | -0.0 |
Price tracking, while beneficial, requires manual or automated resources. Manual tracking is labor-intensive, costing valuable employee time. In contrast, automated tracking requires either subscriptions to existing tools or web scraping solutions that require development resources and infrastructure, such as residential proxies .
Our survey investigated what methods businesses use to harness the benefits of competitor price tracking.
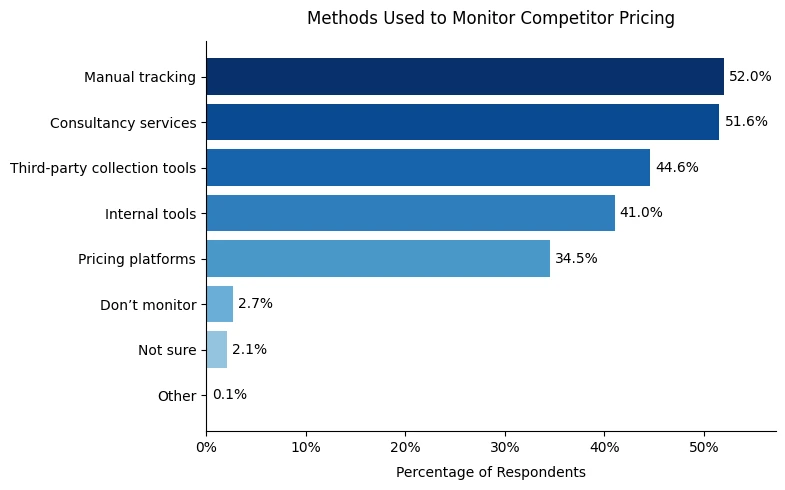
Our respondents indicate that most businesses use a mix of solutions, with manual tracking, consultancy services, and third-party collection tools being the most popular. Few businesses (2.1%) don’t perform any type of tracking.
| Most Used | % Most Used | 2nd Most Used | % 2nd Most Used | |
|---|---|---|---|---|
| Automotive | Manual tracking | 63.6% | Third-party collection tools | 36.4% |
| Banking/Financial | Consultancy | 63.3% | Third-party collection tools | 53.3% |
| Compliance / Risk Management | Consultancy | 57.1% | Third-party collection tools | 53.6% |
| Computer Hardware | Consultancy | 64.8% | Third-party collection tools | 58.0% |
| Computer Reseller | Consultancy | 66.7% | Internal tools | 55.6% |
| Consulting | Consultancy | 56.2% | Internal tools | 40.6% |
| Consumer Electronics | Consultancy | 81.8% | Pricing platforms | 72.7% |
| Consumer Packaged Goods (CPG) | Third-party collection tools | 50.0% | Consultancy | 50.0% |
| Fashion/Apparel | Third-party collection tools | 61.5% | Manual tracking | 53.8% |
| Food and Consumer Products | Manual tracking | 63.4% | Consultancy | 43.9% |
| Hospitality / Tourism | Manual tracking | 66.7% | Consultancy | 48.9% |
| Insurance | Consultancy | 48.1% | Internal tools | 40.7% |
| Market Research | Internal tools | 33.3% | Manual tracking | 33.3% |
| Media / Entertainment | Internal tools | 50.0% | Third-party collection tools | 50.0% |
| Retail | Manual tracking | 52.1% | Internal tools | 38.9% |
| Sales | Manual tracking | 55.0% | Internal tools | 50.0% |
| Telecommunications | Manual tracking | 56.1% | Consultancy | 52.6% |
While, as previously mentioned, most of the fame is taken up by manual tracking and consultancy services across industries, a few distinct players emerge. Consumer Packaged Goods (CPG) and Fashion/Apparel industries are the most likely to use third-party data collection tools as their primary source of price tracking.
These industries also report the most revenue from online channels, indicating that as businesses increase their digital footprint, automated tracking becomes more important as well.
In general, using automated tracking solutions (such as web scraping) is quite popular, regardless of industry.
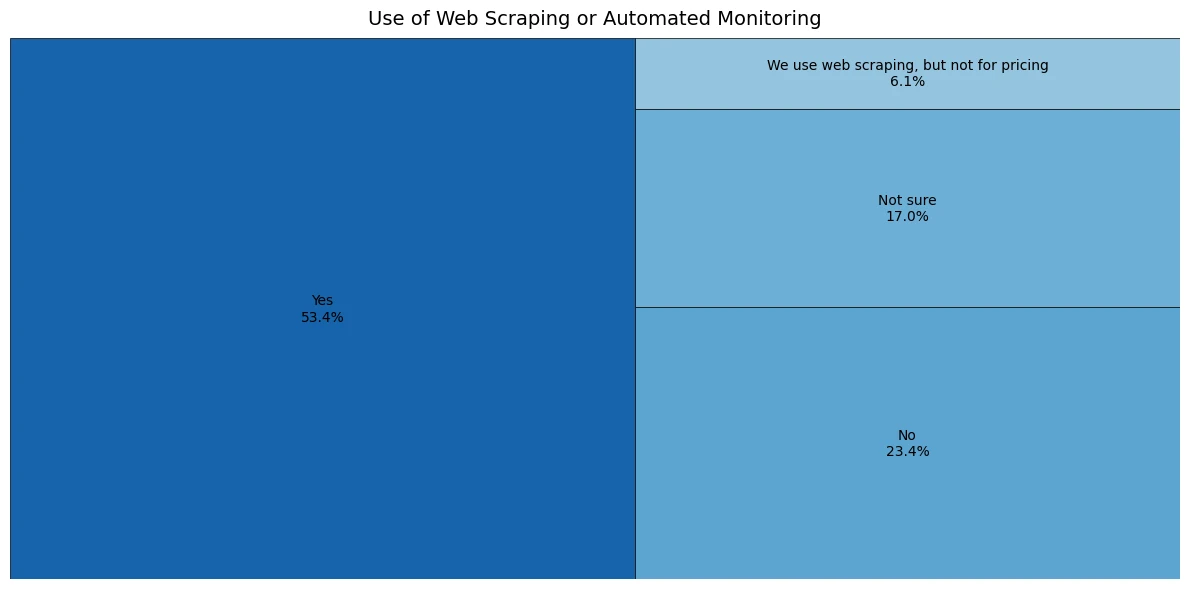
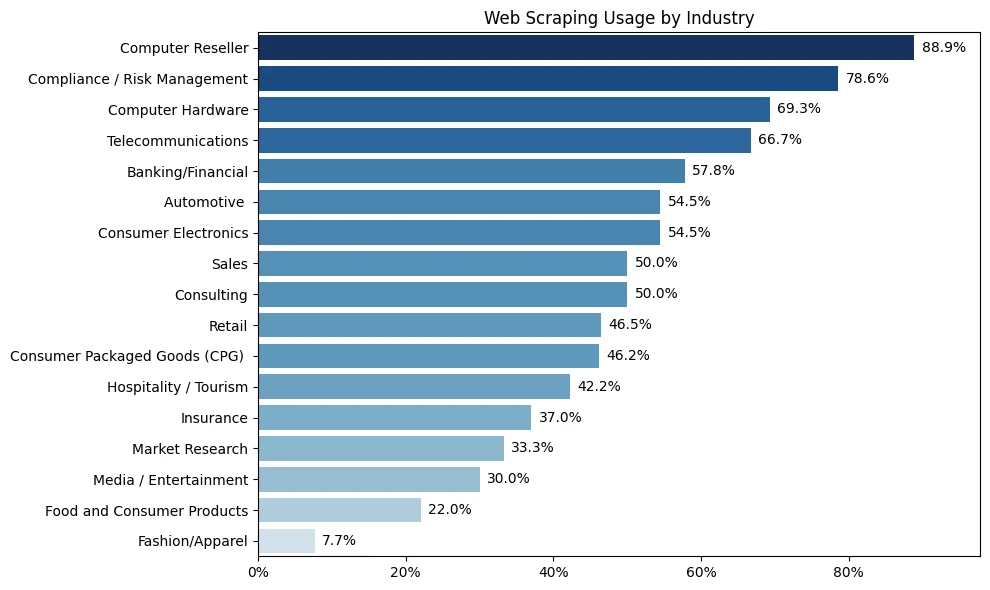
As one might suspect, web scraping usage differs greatly by industry. Industries with technology at the core of their business model engage in web scraping more frequently, which is also reflected in the survey data.
Maintaining Price Competitiveness
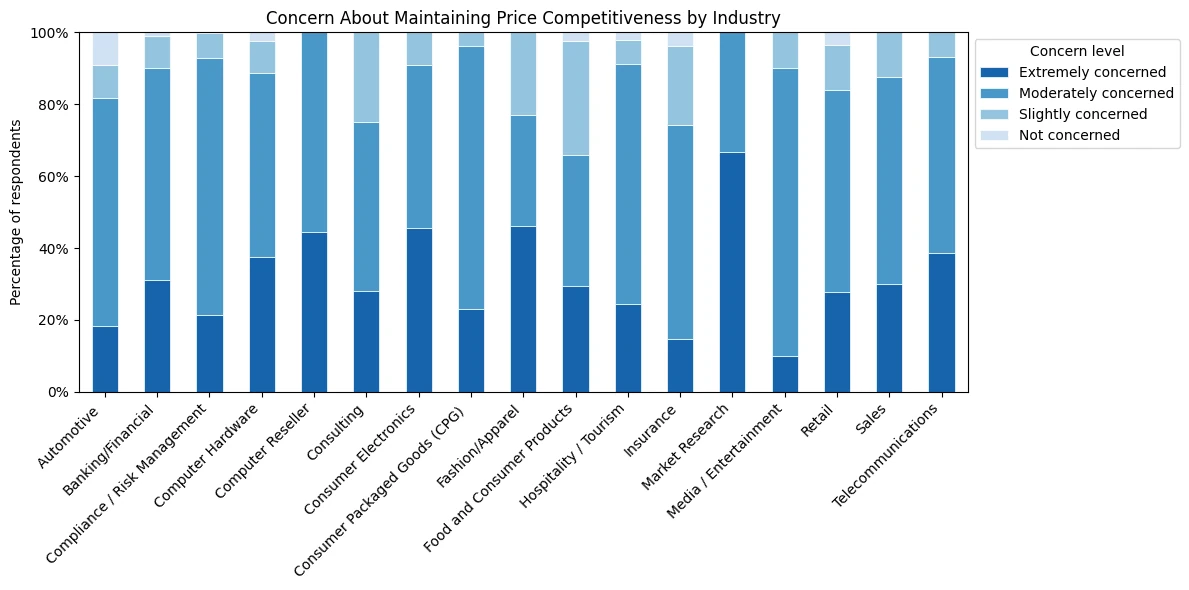
Businesses show high levels of concern regarding maintaining price competitiveness in the current market state. Respondents chose Extremely concerned at a rate of 30%, while Moderately concerned ran up to 56%, together making nearly 90% of all answers.
| Extremely concerned | Moderately concerned | Slightly concerned | Not concerned | |
|---|---|---|---|---|
| Automotive | 18.2% | 63.6% | 9.1% | 9.1% |
| Banking/Financial | 31.1% | 58.9% | 8.9% | 1.1% |
| Compliance / Risk Management | 21.4% | 71.4% | 7.1% | 0.0% |
| Computer Hardware | 37.5% | 51.1% | 9.1% | 2.3% |
| Computer Reseller | 44.4% | 55.6% | 0.0% | 0.0% |
| Consulting | 28.1% | 46.9% | 25.0% | 0.0% |
| Consumer Electronics | 45.5% | 45.5% | 9.1% | 0.0% |
| Consumer Packaged Goods (CPG) | 23.1% | 73.1% | 3.8% | 0.0% |
| Fashion/Apparel | 46.2% | 30.8% | 23.1% | 0.0% |
| Food and Consumer Products | 29.3% | 36.6% | 31.7% | 2.4% |
| Hospitality / Tourism | 24.4% | 66.7% | 6.7% | 2.2% |
| Insurance | 14.8% | 59.3% | 22.2% | 3.7% |
| Market Research | 66.7% | 33.3% | 0.0% | 0.0% |
| Media / Entertainment | 10.0% | 80.0% | 10.0% | 0.0% |
| Retail | 27.8% | 56.2% | 12.5% | 3.5% |
| Sales | 30.0% | 57.5% | 12.5% | 0.0% |
| Telecommunications | 38.6% | 54.4% | 7.0% | 0.0% |
A few outliers can be noted, such as the Automotive industry showing the highest results for no concern ( 9.1% ), and the Consumer Packaged Goods, Retail, and Compliance industries showing the highest moderate levels of concern.
Additionally, electronics in general (Computer Reseller, Computer Hardware, Consumer Electronics) seem to show high levels of concern in both the Extremely concerned and Moderately concerned brackets.
Market Research industry data should be treated with caution, as there were only three respondents.
Respondents were also asked to answer the following question on a 1 to 5 scale:
What are the biggest challenges your company faces in staying price-competitive during economic downturns?
A small list of possible options was provided:
- Limited tools or resources to respond to rapid market changes
- Maintaining profit margins
- Navigating regulatory changes or tariffs
- Difficulty forecasting market shifts
- Limited access to real-time market data
According to the survey data, the most pressing challenge overall is maintaining profit margins (rated as most severe by 37.3% of respondents ). In comparison, the least pressing is access to real-time data (rated as least severe by 34.8% of respondents ).
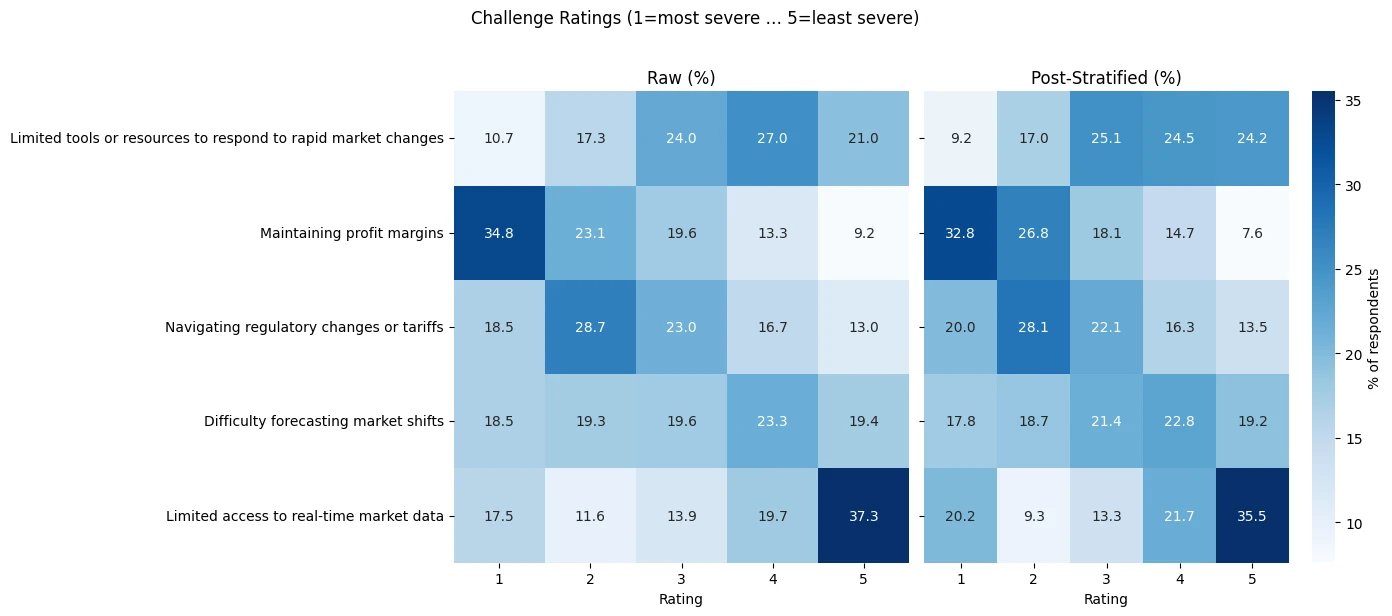
Other challenges are more equally distributed among participants, showing no significant preference for the 2nd greatest challenges or the like.
There are, however, significant differences across industry ratings. Aggregated data, as shown above, can sometimes hide important information when considering industry specifics.
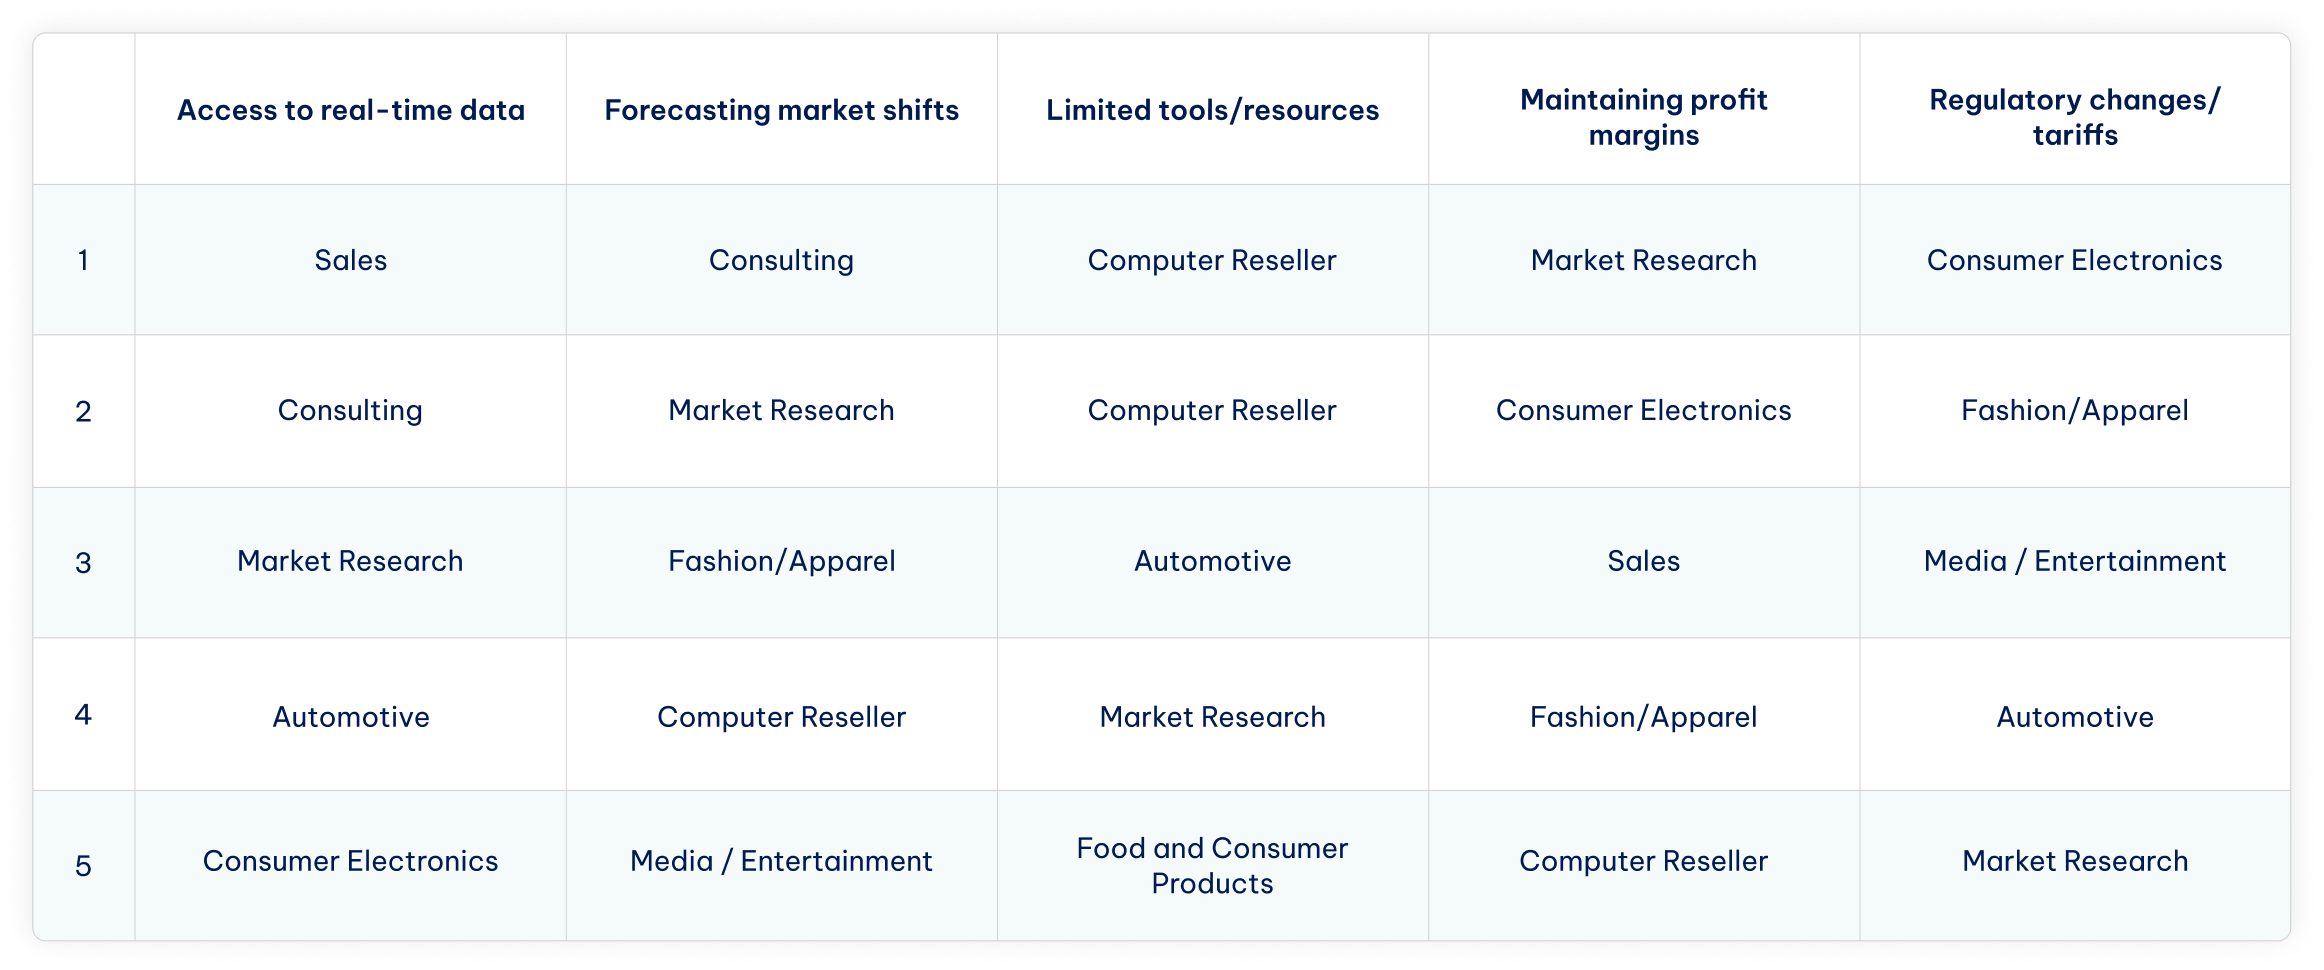
As we can see from the table above, respondents in the Sales industry most often picked access to real-time data, while regulatory changes and tariffs were considered the greatest challenge by Consumer Electronics.
Some caution is advised, as the table above shows the most frequently picked challenge by industry and rating. Not all industries made it into the list (e.g., Retail) as their ratings may have been distributed more evenly, or they were less likely to pick a specific challenge and rating than a smaller industry.
Concretely, it’s the frequency of pick as a percentage of that industry’s respondents, not raw counts across all industries. This way, each industry “competes” on an even footing regardless of how many total responses it contributed.
Summary & Key Findings
Surveying 675 respondents in over 17 industries (with a focus on those that have a digital presence) provided highly specific economic and business insights.
Digital Revenue Dependence
- About 25% of businesses report that ≥50% of their revenue comes from online channels, while the majority (roughly 50–75% of respondents) fall in the 25–49% bracket.
- Consumer Packaged Goods (CPG) has the highest share of companies generating ≥50% of revenue online.
Key Economic Drivers of Pricing
- Inflation (74.5% of respondents) and tariffs (65.5%) top the list of factors prompting price adjustments.
- Other close contenders include supply-chain disruptions (53.5%) and market uncertainty (50.4%).
- Competitor price changes (47.70%) were at the bottom of the priority list when adjusting pricing.
High Price Sensitivity
- Over 90% of companies say price matters in buying decisions:
- 30.2% call their market “extremely price sensitive” (small changes drive behavior).
- 64.6% view price as one of several key factors.
- Technology-heavy industries (Consumer Electronics, Telecommunications, Computer Reseller) skew toward extreme sensitivity.
Proactive Pricing & Competitor Tracking
- 70% use data-driven, proactive pricing strategies; only 4.3% keep prices static.
- Nearly 100% factor in and track competitor pricing at some level:
- More than 21% treat it as a primary consideration.
- Heavy trackers report more revenue gains ( 62% vs. 42% vs. 27% ) and stronger competitive positioning ( 66% vs. 55% vs. 30% ).
Tracking Methods by Industry
- Manual tracking , consultancy , and third-party tools dominate overall.
- Technology-centric and CPG/Fashion firms lean more on automated solutions (web scraping, pricing platforms).
Price-Competitiveness Concerns
- Nearly 90% are moderately (56%) or extremely (30%) concerned about staying price-competitive.
- The highest “ not concerned ” rates appear in Automotive (9%), while Market Research, despite its tiny sample, shows 100% at least moderately worried.
Top Challenges in Downturns
- Maintaining profit margins is rated the single biggest hurdle (37.3% chose it as their #1 challenge).
- Access to real-time data is seen as least critical (34.8% rank it #5).
- Industry nuances:
- Sales industry professionals flag real-time data access as the greatest challenge.
- Consumer Electronics cite tariffs/regulations as their top challenge.
These findings underscore that as economic and geopolitical headwinds intensify, businesses—especially those with strong digital footprints—are in a position to find new methods of increasing profits while maintaining overall competitiveness in their field.
One of the possible solutions to increased revenue without a significantly negative impact on consumer sentiment or costs could be automated data acquisition. Those who implement increasingly strong price tracking often report various benefits derived from the practice at greater rates than those who track more modestly.